
Friday, May 31, 2013
Thursday, May 30, 2013
Astro Technicals May 30 2013
Nifty is likely tracing out a big irregular flat, with a strong B Wave.Wave A of the down move from 6111.80 had ended on April 10 at 5477.20. Thereafter we had begun wave B. Wave A of the wave B had ended on May 20 at 6229.45.After that we are in wave b of B.This should end either today or tomorrow, possibly at 6054 or 6039. We should then see wave c of B upwards. This ought to top out around 6200 levels, possibly between June 08 to June 15, more likely towards the latter date.


If Nifty closes below 6038, then we assume a longer c of B is being traced out and then the support could be around 5925, on the 1x8 line as shown above.
Of course, we only follow Nifty, even though we crane our necks to try and fathom where in God's name she really is wanting to go! To prevent hurts, we resort to stop losses of course.
Tuesday, May 28, 2013


Sunday, May 26, 2013
Nifty Long Term and Near Term As seen in May 2013


Astro Technicals May 26 2013
On May 27th, for Nifty futures,
Jupiter,Mercury and Venus are conjunct with Natal Sun and Venus.
Mars is conjunct with Natal Jupiter.
Sun trines Natal Neptune
Venus trines Natal Uranus.
Mars trines Natal Ketu.
Uranus trines Natal Pluto
Rahu trines Natal Mercury
Saturn alone squares Neptune
On May 29th, Mercury conjuncts with Natal Mars and trines Natal Moon.
On May 31, Venus also trines Natal Moon.
At least to me it looks that Nifty`s planets are mostly positive with some negativity only towards the weekend.
Let us examine the Universal positions.
On May 27th and 28th, Sun squares Neptune.Venus and Mercury are conjunct Jupiter.This lasts upto May 30th.Rahu becomes natural retro by May 27th. Moon will be at its Perigee ( closest to Earth) and at a minimum declination by May 27th.
Saturn trines Neptune throughout the week.
Uranus and Pluto are square throughout.
On May 30 2013, at 20:24:26 hrs, Jupiter moves into Gemini.It will remain in Gemini till June 18,2014, 21:39:26 hrs.
On May 31, Sun and Mars begin to separate beyond 10 degrees.
on June 08, Mercury will be square Uranus and opposite Pluto:
Between June 11 to 13, Venus will be opposite Pluto and square Uranus.
The long term square aspect of Uranus and Pluto gets activated in this time band of June 08 to 13.
June 08 to 13 may be watched for a reversal.
As expected we had seen a declining trend from May 20 till 24. Now the trend could change again for a last upmove.
I repeat my earlier conjecture...
"By June 10, 2013, Rahu enters Ketu Sub and that could be a top formation time? Especially since Ketu is in the midpoint of Uranus and Sun? Two hot guys? "
One more thing about sensitive degree transitions...Iam reproducing this chart as a recap...
We see several planets were transiting a singular sensitive band of 22 to 27 degrees of various signs.On June 08, Sun and Moon will become conjunct and form a New Moon at 24:03:53 degrees, at 21:27:02 hours.This gives additional credence to the June 08-13 being an important time band for reversals.

June 08: New Moon
June 09: Maximum declination ( Sunday)
June 10: Moon Apogee
June 13: Minimum Latitude.
It all seems to fit.
What sort of prices should we look..
at?
Here are expected supports.
 And some interesting angles.
Let us watch the 1X1 45* line..Nifty seems to like it.

Statutory warning: Wait till prices turn..Have trailing stop losses if you are short.If you intend to go short, wait for a bounce. Here again, if prices move up as anticipated we run the risk of being caught on the wrong step.So again have stop losses.If you are stopped out either way reverse direction and follow Nifty. There is still money to be made.
Jupiter,Mercury and Venus are conjunct with Natal Sun and Venus.
Mars is conjunct with Natal Jupiter.
Sun trines Natal Neptune
Venus trines Natal Uranus.
Mars trines Natal Ketu.
Uranus trines Natal Pluto
Rahu trines Natal Mercury
Saturn alone squares Neptune
On May 29th, Mercury conjuncts with Natal Mars and trines Natal Moon.
On May 31, Venus also trines Natal Moon.
At least to me it looks that Nifty`s planets are mostly positive with some negativity only towards the weekend.
Let us examine the Universal positions.
On May 27th and 28th, Sun squares Neptune.Venus and Mercury are conjunct Jupiter.This lasts upto May 30th.Rahu becomes natural retro by May 27th. Moon will be at its Perigee ( closest to Earth) and at a minimum declination by May 27th.
Saturn trines Neptune throughout the week.
Uranus and Pluto are square throughout.
On May 30 2013, at 20:24:26 hrs, Jupiter moves into Gemini.It will remain in Gemini till June 18,2014, 21:39:26 hrs.
On May 31, Sun and Mars begin to separate beyond 10 degrees.
on June 08, Mercury will be square Uranus and opposite Pluto:
Between June 11 to 13, Venus will be opposite Pluto and square Uranus.
The long term square aspect of Uranus and Pluto gets activated in this time band of June 08 to 13.
June 08 to 13 may be watched for a reversal.
As expected we had seen a declining trend from May 20 till 24. Now the trend could change again for a last upmove.
I repeat my earlier conjecture...
"By June 10, 2013, Rahu enters Ketu Sub and that could be a top formation time? Especially since Ketu is in the midpoint of Uranus and Sun? Two hot guys? "
One more thing about sensitive degree transitions...Iam reproducing this chart as a recap...
We see several planets were transiting a singular sensitive band of 22 to 27 degrees of various signs.On June 08, Sun and Moon will become conjunct and form a New Moon at 24:03:53 degrees, at 21:27:02 hours.This gives additional credence to the June 08-13 being an important time band for reversals.

June 08: New Moon
June 09: Maximum declination ( Sunday)
June 10: Moon Apogee
June 13: Minimum Latitude.
It all seems to fit.
What sort of prices should we look..
at?
Here are expected supports.

Let us watch the 1X1 45* line..Nifty seems to like it.

Statutory warning: Wait till prices turn..Have trailing stop losses if you are short.If you intend to go short, wait for a bounce. Here again, if prices move up as anticipated we run the risk of being caught on the wrong step.So again have stop losses.If you are stopped out either way reverse direction and follow Nifty. There is still money to be made.
Saturday, May 25, 2013


Friday, May 24, 2013
Nifty Astro Technicals May 24 2013


This blog will not be updated for some time because of a special professional assignment I have undertaken. I shall let all readers know when I am back in circulation.
Meanwhile happy and safe trading!
Tekkie Suresh
Thursday, May 23, 2013
Astro Technicals May 22 2013
In our previous astro post we had mentioned about consolidation happening till May 27- that is what we seem to witness now.


On a weekly scale the uptrend contiues ....

In the 2 minute chart, we see a breakdown from a trading range and a double bottom around 6075 area. In the final 30 minutes, prices have recovered close to 6094 ranges.6083 represented the 61.8% retracement area for the drop from 6229.

The first down cycle has been convincingly been penetrated on the upside. So the next larger cycle seems to indicate that after this correction Nifty should move beyond 6240 in the next uptrend....Awaiting confirmation from Market.

The current B leg has already consumed 26 days and has retraced Wave A by 152.29% And it still seems to have legs for one more up move.In such a case Wave C when it commences may not retrrace the currently forming B wave beyond 61.8 %.
If we look at the alternative count and consider this to be the diametric Wave D, then the current upmove is wave g. In such a scenario, wave g will be completely retraced down to 5477 levels.

Moreover then we could consider the rise from 4531 from December 2011, to be complete only when the current upmove tops out.Mind you, in such a case, wave D would have consumed 18 months of uptrend.

On a weekly scale the uptrend contiues ....
Tuesday, May 21, 2013

Monday, May 20, 2013

Sunday, May 19, 2013
Astro Technicals for May 20 to 24- The astro part
There are several interesting astro aspects in the balance portion of May 2013 and from June onwards.I had detailed out a chart explaining the various long term formation in store for us for the rest of 2013. One of the most important of them- Uranus square Pluto is on May 20, 2013.Long term formations do not give effect on the day of their exact signature -they will always have an orb of influence.They need one more planet, a slow moving one to connect among themselves.
So
on June 08, Mercury will be square Uranus and opposite Pluto:
Between June 11 to 13, Venus will be opposite Pluto and square Uranus.
June 08 to 13 may be watched for a reversal.One thing to be noted is that Uranus is a planet of unpredictability.Gemini is a dual sign. Mercury its lord, who is also in Gemini is known for its dualistic approach.So any reversal or fall in prices may be quickly offset- or the fall could be deeper than expected. In other words let us expect the unexpected.
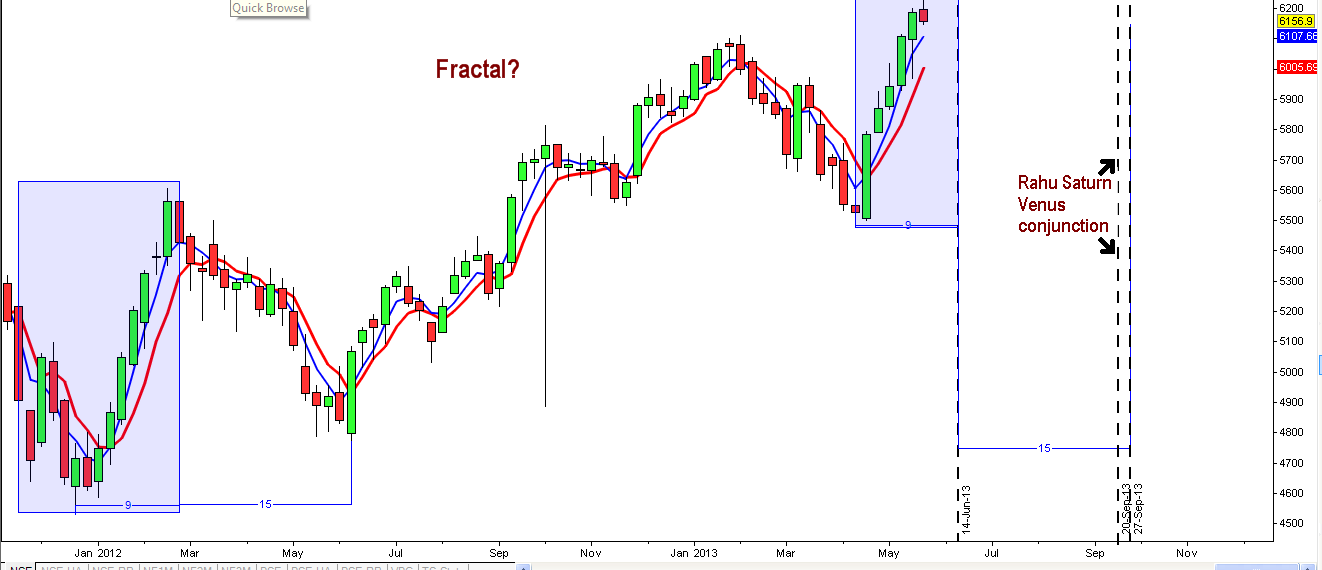
 We see that from May 15th, Nifty has entered its Venus Bhukti Venus Antara and Rahu sookshma. We have seen earlier that in market conditions where there wasn't any meaningful correction in Sun and Mars sookshma, Rahu brings about the needed correction..
Another interesting astro aspect is the joint celestial movements of Sun and Mars...
See this....
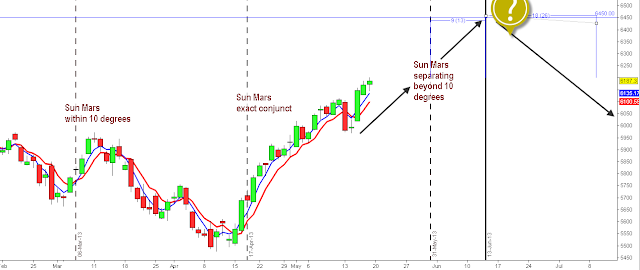
Within 3 days of Sun and Mars coming together, an intermediate top was formed and Nifty began a decline. 3 days before they become conjunct, Nifty begins a powerful ascent which is still continuing.
Sun and Mars will be separated beyond 10 degrees on May 31,-what is going to happen then?
Let us look at the past for a guideline...

Nine days after separating beyond 10 degrees, Nifty had fallen 500 points within 18 trading days..
In our present situation, 9 trading days comes to June 13.So will there be a top by June 13?
We had seen that Uranus Pluto combination points out to a top between June 08 and 13, 2013.
Are there other astro evidences?
Let us look at a magnified Venus Antara Rahu Sookshma period...

In the post,
http://niftyastrotechnicals.blogspot.in/2013/04/astro-technicals-dasa-formation-and.html
we saw that Venus Antara Rahu Sookshma tends to produce reversals from crests depending on other astrological aspects present.I have given a little more detailed picture on what is happening to Rahu during this time and how are the lunar factors shaping up..
We know Rahu and Ketu move in a retrograde fashion. So after Venus sub what should come is not Sun Sub, but for retro movement we should have Ketu, Mercury, Saturn and Jupiter.On May 17,Rahu is direct and behaves like other direct moving planets.Till May 24, it moves direct. Then becomes retro. This retro to direct to retro movement sometimes causes short term reversals in the market.Effects of Perigee and minimum declination of the Moon happens on May 27. So maybe we see a consolidation or slight decline till May 27 and then the up-trend resumes again. Latitude and Mercury declination may add more steam till June 03. Then again it looks like consolidation..By June 10, 2013, Rahu enters Ketu Sub and that could be a top formation time? Especially since Ketu is in the midpoint of Uranus and Sun? Two hot guys?
Interesting times astrologically, like I said in the beginning.
For us traders, just hold on to the moving averages and start hedging as the market climbs higher. With so much of up trend already complete risk favours not to be indiscriminately long.

Some of the other indices are not showing as much enthusiasm as the Nifty. Any rally where the broader market does not participate as much, must be treated with caution.
Have a nice week of trading! Astro tutorials will be taken up next week.
So
on June 08, Mercury will be square Uranus and opposite Pluto:
Between June 11 to 13, Venus will be opposite Pluto and square Uranus.
June 08 to 13 may be watched for a reversal.One thing to be noted is that Uranus is a planet of unpredictability.Gemini is a dual sign. Mercury its lord, who is also in Gemini is known for its dualistic approach.So any reversal or fall in prices may be quickly offset- or the fall could be deeper than expected. In other words let us expect the unexpected.

Another interesting astro aspect is the joint celestial movements of Sun and Mars...
See this....

Within 3 days of Sun and Mars coming together, an intermediate top was formed and Nifty began a decline. 3 days before they become conjunct, Nifty begins a powerful ascent which is still continuing.
Sun and Mars will be separated beyond 10 degrees on May 31,-what is going to happen then?
Let us look at the past for a guideline...

Nine days after separating beyond 10 degrees, Nifty had fallen 500 points within 18 trading days..
In our present situation, 9 trading days comes to June 13.So will there be a top by June 13?
We had seen that Uranus Pluto combination points out to a top between June 08 and 13, 2013.
Are there other astro evidences?
Let us look at a magnified Venus Antara Rahu Sookshma period...

In the post,
http://niftyastrotechnicals.blogspot.in/2013/04/astro-technicals-dasa-formation-and.html
we saw that Venus Antara Rahu Sookshma tends to produce reversals from crests depending on other astrological aspects present.I have given a little more detailed picture on what is happening to Rahu during this time and how are the lunar factors shaping up..
We know Rahu and Ketu move in a retrograde fashion. So after Venus sub what should come is not Sun Sub, but for retro movement we should have Ketu, Mercury, Saturn and Jupiter.On May 17,Rahu is direct and behaves like other direct moving planets.Till May 24, it moves direct. Then becomes retro. This retro to direct to retro movement sometimes causes short term reversals in the market.Effects of Perigee and minimum declination of the Moon happens on May 27. So maybe we see a consolidation or slight decline till May 27 and then the up-trend resumes again. Latitude and Mercury declination may add more steam till June 03. Then again it looks like consolidation..By June 10, 2013, Rahu enters Ketu Sub and that could be a top formation time? Especially since Ketu is in the midpoint of Uranus and Sun? Two hot guys?
Interesting times astrologically, like I said in the beginning.
For us traders, just hold on to the moving averages and start hedging as the market climbs higher. With so much of up trend already complete risk favours not to be indiscriminately long.

Some of the other indices are not showing as much enthusiasm as the Nifty. Any rally where the broader market does not participate as much, must be treated with caution.
Have a nice week of trading! Astro tutorials will be taken up next week.
Friday, May 17, 2013
Astro Technicals May 17 2013
Please have a look at this blog post of January 06, 2013. We had discussed in detail the effect of Jupiter in Taurus and how the big positive planet will not allow a trend which he had commenced, to wither away, as long as he is in Taurus.
http://niftyastrotechnicals.blogspot.in/2013/01/astro-technicals-jupiter-and-taurusway.html
Well, Jupiter leaves Taurus on May 29th.So the current bullish fervour should last till Jupiter moves into Gemini.Mind you there could be corrections on the way, but mostly the bull trend will be maintained, is what I feel.Also whenever Uranus and Pluto are square and if Jupiter is also entering Gemini, then a blow off is seen. The severity of decline which happens afterwards depend on the long term planetary configurations afterwards.
We have already moved into life time high spaces...Several world Indices are already there. We do not see a wholesome all encompassing euphoria--definitely mass participation is absent because of the difficult Uranus Pluto combination.
So we conclude that we are in a powerful bull phase right now.
What caused the current big leg up and how long will it last? Have a look at the astro charts below.
 We see that when several planets transited sensitive 17* of the chart, and when long term planets were involved in a mid point formation, we saw the beginnings of a huge rise.
We again see the confluence of several planets in the degrees of 26* and the New Moon Lunation of June 08 looks important, enough to cause a break in the current rise.Will there be a powerful reversal? We need to research further.
That will also be the period when Nifty will be going through Venus Antara Rahu sookshma- which again is traditionally associated with reversals. I had dealt with elaborately with these Dasa aspects in previous posts.
What about other studies? What do they indicate?

This is a long term cycles chart. This monthly chart also tells us that we are close to a top formation. We shall guess later as to what type of targets can be assigned.
Long term cycles tend to distort a lot, because of the existence of other cycles.
Let us see another long term chart...
 This long term weekly chart also shows that we have major resistances in the 6338 areas.6338 is only 168 points away.

In the daily cycles chart, the resistances we see are 6250, 6300 and 6350.
 We can see the 6250 resistance levels more clearly in this chart.
What does our Neo Wave analysis say?
Down move of May 13, took out 5 previous bull candles.The correction did not consume much time at all.So we assume that the a wave of B is still continuing.Currently we should then be c wave of a of B.

Wave B has retraced 119% of A.Strength of the move implies that it could go to 6354 even.This is also close to 6338, November 2010 top.
We may also consider the following alternative view, since B had further moved up surprisongly.

Here we consider the entire move from 4531, from December 2011 as a Diametric, bow tied.If so we are in the leg G, which should terminate around 6350.
Here is the 30 Minute chart for our understanding...

Present intra day stalling could be minute wave b.Next leg up may begin next week. Since prices have moved up so much volatility and two way movements cannot be ruled out.
Stop loss cannot be insisted more strongly.
We want each of the blog reader to be successful, safe and contented in trading.
http://niftyastrotechnicals.blogspot.in/2013/01/astro-technicals-jupiter-and-taurusway.html
Well, Jupiter leaves Taurus on May 29th.So the current bullish fervour should last till Jupiter moves into Gemini.Mind you there could be corrections on the way, but mostly the bull trend will be maintained, is what I feel.Also whenever Uranus and Pluto are square and if Jupiter is also entering Gemini, then a blow off is seen. The severity of decline which happens afterwards depend on the long term planetary configurations afterwards.
We have already moved into life time high spaces...Several world Indices are already there. We do not see a wholesome all encompassing euphoria--definitely mass participation is absent because of the difficult Uranus Pluto combination.
So we conclude that we are in a powerful bull phase right now.
What caused the current big leg up and how long will it last? Have a look at the astro charts below.

We again see the confluence of several planets in the degrees of 26* and the New Moon Lunation of June 08 looks important, enough to cause a break in the current rise.Will there be a powerful reversal? We need to research further.
That will also be the period when Nifty will be going through Venus Antara Rahu sookshma- which again is traditionally associated with reversals. I had dealt with elaborately with these Dasa aspects in previous posts.
What about other studies? What do they indicate?

This is a long term cycles chart. This monthly chart also tells us that we are close to a top formation. We shall guess later as to what type of targets can be assigned.
Long term cycles tend to distort a lot, because of the existence of other cycles.
Let us see another long term chart...


In the daily cycles chart, the resistances we see are 6250, 6300 and 6350.

What does our Neo Wave analysis say?
Down move of May 13, took out 5 previous bull candles.The correction did not consume much time at all.So we assume that the a wave of B is still continuing.Currently we should then be c wave of a of B.

Wave B has retraced 119% of A.Strength of the move implies that it could go to 6354 even.This is also close to 6338, November 2010 top.
We may also consider the following alternative view, since B had further moved up surprisongly.

Here we consider the entire move from 4531, from December 2011 as a Diametric, bow tied.If so we are in the leg G, which should terminate around 6350.
Here is the 30 Minute chart for our understanding...

Present intra day stalling could be minute wave b.Next leg up may begin next week. Since prices have moved up so much volatility and two way movements cannot be ruled out.
Stop loss cannot be insisted more strongly.
We want each of the blog reader to be successful, safe and contented in trading.
Wednesday, May 15, 2013

Tuesday, May 14, 2013
Astro Technicals for May 15, 2013

During the recent uptrend Nifty had taken support on the 25% line. It has now violated and has reached the 50% line.There is a good chance that Nifty may take support at 5870 to 5900 levels.

USD INR flashes ominous signals....

USD looks to breach the 2-4 line, upwards. This is a strong bull signal for USD. If so the next pit stop is going to be 57.
That is not going to go well with the Equity markets....
Sunday, May 12, 2013
Long Term Planetary Signatures May to September 2013
Starting from May 20, 2013 to September 2013, we have a series of important planetary configurations all involving slow moving planets, which are credited with setting long term effects in motion.


First of all we are in the middle of the significant Uranus Pluto 7 series signatures- the mid period has been shaded for better illustration.
As an answer to the excesses and rampant misuse of public funds by large Institutions and Banks, up to the first three signature periods, Central Banks have chosen to print money by the truck loads and buoy up the market sentiments. The thinking is if you flood the market with enough liquidity some of it will stick and bring back the growth which is badly needed.
With long term signatures the effects start manifesting in the middle periods. And from May 20, we will be into the middle period for Uranus Pluto signatures.By September 20, Pluto becomes direct in Pooradam star, ruled by Venus. Venus stands for currencies and Pluto is for massive debts.By the time a greatly fortified Saturn because of its exaltation and also because of the presence of Rahu nearby will be aspecting Pluto by its third aspect. Now secrets of big bankers and deceptions in the financial world will start becoming exposed.By December 17, Uranus also becomes direct and we should have a far clearer picture of the murky goings on in the financial spaces of the globe.
Jupiter entering Gemini generally is a trend changer. With Uranus square Pluto nearby, this portends changes in long term trends.
Saturn turning direct could be bullish for some markets like Nifty for instance. A grand trine involving Jupiter, Neptune and Saturn will spell much hope and optimism and spark the market to bigger highs.
However the month of August looks ominous with Jupiter getting involved with Uranus and Pluto.
By September 16, we have Rahu conjunct Saturn in Rahu star-quite a combination! And it is happening in Nifty`s fourth house, the house of Nadir or low point.
Iam not suggesting anything here but just that there could be heavy volatility in the months ahead and it should be pretty interesting times for traders to make pots of money!
Just have to figure out the trend directions well in time!
Astro Technicals The wave picture for May 13 to 31 2013
On May 11, 2013, Nifty had fully retraced the fall from
6111.80 to 5477.20.While the fall had consumed 49 trading days, from January
29, 2013 to April 10, 2013, the retracement had been pretty quick- in just 20
days.
·
As per Neowave if the correction from 6111.80
has to be a flat, then it has to form a 3-3-5 structure. Wave A down, from
6111.80 has exhibited a 3 wave down formation.
·
So by the same logic, what we are seeing in wave
B so far, in the retracement from 5477 upwards is just wave a of B.
·
We do not yet know if wave a of B is completed. But
the risk reward ratio is tilting towards shorts, after 20 days of up move.
Traders also realise this, which is reflecting in the reduced volumes.
·
We still have to see wave b of B downwards and
Wave c of B upwards.
·
And this has to take time to complete-
approximately a minimum of 30 more trading days.
·
Any which way we look at the situation, we are
seeing a Wave B which is going to be stronger than wave A.
·
If the completed wave B terminates between 6112
and 6262, then also the consequent wave C has a good chance to go down to 5477
levels in a 5 wave impulse down.
·
If the completed wave B exceeds 6336-6354, then
wave C down, will not go beyond 5796. In
that case we will be looking at an Irregular flat with C wave failure, which
will be very bullish for the next development.
·
If wave B terminates at these levels itself,
that is wave b of B retraces to 5750 levels and then again wave c of B comes up
to 6111 and then falls off, we can see the resultant wave C going beyond 5477
in a 5 way down move.


Our immediate requirement is to know when a of B will end?
Astrologically we are still in the reversal time band- so let us wait and watch.
Personally I prefer to wait for price to close below the little blue and red
averages, before taking a short. It will be prudent for longs to book partial
profit and trail the rest positions with a tight stop loss.
Happy and safe trading!
Saturday, May 11, 2013
Astro Technicals for May 13 to 17 2013
Fuelled by Global buoyancy which manifested as FII buying, Nifty continued its climb towards a crest known only to her!
Our astro time band expected for a reversal is May 08 to 15, so next week is to be watched keenly.Since the weekly closing is in a strong mode, we simply continue to hold on to our trailing stop losses, watching for signs of a lower high- lower low formation and a break of 6046 on a closing basis.
Iam reproducing the chart with the lunar notations and dasa periods. We had, in the post, http://niftyastrotechnicals.blogspot.in/2013/04/astro-technicals-dasa-formation-and.html
expected that Nifty may reverse in the Mars sookshma period, failing which it will happen in the Rahu sookshma period.Mars sookshma is upto May 15 and Rahu sookshma then takes over till June 17th.
Since other aspro aspects are getting bunched up for effects between May 08 to 15, next week assumes added significance.
.png)
As per Gann and Fibo,Gann line violation could happen around 6046-if Nifty closes below it. All plausible retracement levels have been indicated here.


 Here is a collection of steep rises in Nifty, in the past few years.All instances in the past were trend changers.
Happy and safe trading !
Our astro time band expected for a reversal is May 08 to 15, so next week is to be watched keenly.Since the weekly closing is in a strong mode, we simply continue to hold on to our trailing stop losses, watching for signs of a lower high- lower low formation and a break of 6046 on a closing basis.
Iam reproducing the chart with the lunar notations and dasa periods. We had, in the post, http://niftyastrotechnicals.blogspot.in/2013/04/astro-technicals-dasa-formation-and.html
expected that Nifty may reverse in the Mars sookshma period, failing which it will happen in the Rahu sookshma period.Mars sookshma is upto May 15 and Rahu sookshma then takes over till June 17th.
Since other aspro aspects are getting bunched up for effects between May 08 to 15, next week assumes added significance.
.png)
As per Gann and Fibo,Gann line violation could happen around 6046-if Nifty closes below it. All plausible retracement levels have been indicated here.


Happy and safe trading !
Friday, May 10, 2013
Flattered to deceive
Nifty has been playing hide and seek- always seeming to break down and then recovering in the last hours of trade.Again she has closed in the negative- not a violent closure but sort of dipping, wanting to take on more traders on board.
We are now in the astro time band for a reversal.
Will it be a reasonably good slide or will it be only intraday corrections?


We are now in the astro time band for a reversal.
Will it be a reasonably good slide or will it be only intraday corrections?


Everything now depends on the follow through price action in Nifty.
Thursday, May 9, 2013
Nifty Astro Technicals May 08, 2013
Nifty has so far retraced 95.5% of the fall from 6111.80 to 5477.20.The trendline connecting 6338.50 and 6111.80 is currently at 6088.66 and today Nifty made a high of 6083.50.Timewise this upward retracement has taken 33% of the time taken by wave A.
Technically what could happen from now on?

Let us examine the daily charts from a medium term perspective.
A Flat Correction pattern exhibits a 3-3-5 pattern, where 3,3 and 5 are sub waves.
Wave A exhibits a 3 wave correction.
For Nifty to play out the current moves as a Flat, Wave B also must have 3 waves.
Currently we are in Wave a of Wave B. Assuming wave B is of 3 sub waves, we note that the very first wave a of B,has already retraced wave A by 95.5% that too in just 17 days, tells us that wave B has bright chances of going over 100% of wave A by the time wave c of wave B will be over.
As per Neowave rules,
1. Normal B wave should retrace wave A by 81 to 100%.( Wave B has so far retraced Wave A by 95.5%). In other words, if Nifty reverses from here, then we can reasonably expect a normal B wave is unfolding.
2.In such cases, wave b of B should not retrace beyond 5719 ( 61.8%) and wave c of B will mostly be equal to wave a of B. ( the current upmove)
3. In such a scenario wave c of B is likely to retrace all of wave b of B, which means if wave b of B falls to the vicinity of 5719, then wave c of B will take it back to 6100 levels.If Nifty is forming a common Flat,then Wave c of B could also go up to 138.2% of wave b of C, which is around the region of 6245-6275.
4. Since wave B normally consumes more time than wave A ( down move from 6111.80) and since it has consumed only 17 trading days,waves b of B and c of B may consume 32 more days to complete their Wave B formation.
So we wait for Nifty to give us clear signals regarding the direction. At present we trail our stops tighter and tighter.And wait for a reversal to book profits on the longs.
Technically what could happen from now on?

A Flat Correction pattern exhibits a 3-3-5 pattern, where 3,3 and 5 are sub waves.
Wave A exhibits a 3 wave correction.
For Nifty to play out the current moves as a Flat, Wave B also must have 3 waves.
Currently we are in Wave a of Wave B. Assuming wave B is of 3 sub waves, we note that the very first wave a of B,has already retraced wave A by 95.5% that too in just 17 days, tells us that wave B has bright chances of going over 100% of wave A by the time wave c of wave B will be over.
As per Neowave rules,
1. Normal B wave should retrace wave A by 81 to 100%.( Wave B has so far retraced Wave A by 95.5%). In other words, if Nifty reverses from here, then we can reasonably expect a normal B wave is unfolding.
2.In such cases, wave b of B should not retrace beyond 5719 ( 61.8%) and wave c of B will mostly be equal to wave a of B. ( the current upmove)
3. In such a scenario wave c of B is likely to retrace all of wave b of B, which means if wave b of B falls to the vicinity of 5719, then wave c of B will take it back to 6100 levels.If Nifty is forming a common Flat,then Wave c of B could also go up to 138.2% of wave b of C, which is around the region of 6245-6275.
4. Since wave B normally consumes more time than wave A ( down move from 6111.80) and since it has consumed only 17 trading days,waves b of B and c of B may consume 32 more days to complete their Wave B formation.
So we wait for Nifty to give us clear signals regarding the direction. At present we trail our stops tighter and tighter.And wait for a reversal to book profits on the longs.
Subscribe to:
Posts (Atom)