Pages

Sunday, July 27, 2014

Nifty Astro Technicals July 28 to August 01, 2014

As expected Nifty continued on its bullish ways and encountered some profit taking on Friday.However internals look weaker. Midcaps sold off much more than Nifty which itself was supported by some select scrips.
Let us see how the charts look like going forward...

Possibility 01, suggests that the upmove with much volatility, to continue this truncated week also.There could be a gap down on Monday due to global factors, but Nifty is expected to recover some more.As per Neowave, we are in wave b of wave f, which could terminate soon, possibly on August 01.Thereafter, wave c should commence as a down move..It could gather force once it crosses 7750-7730.
Another possibility is that we are in wave g of wave F which could move up some more and terminate wave F. Thereafter larger wave G should commence. This possibility can be confirmed only when the down move crosses 7422 convincingly on the downside.

These two charts above are daily charts.
Considering possibility one more favourably, and if we look at 30 min charts,

we see that wave b has enough complexity.


Here are the Fibo levels..

This is only after Nifty reverses decisively..
Let us look at Gann angles on a 30 min chart...

How does the weekly chart look with respect to Gann Angles?


We see that Nifty is rising towards the central median line, which has been turning points in the past...

If we consider Nifty cycles on a weekly scale....
We see that the previous significant low happened when the cycles phases shortened from 20 to 9 cycles.In the expansion phase, we are in the fourth phase..which is a final phase.Normal amplitude is 13 weeks and we have already completed 12 weeks. So a significant toip seems to be round the corner..

Here is a summation of all aspects till August 08, 2014...

July 21: Saturn turns direct on. Reversal period within 4 to 7 trading days)
July 22 Uranus turns retrograde (Reversal period within 4 to 11 trading days)
July 25, 02.30 am, Sun is conjunct Jupiter. Which means Jupiter is conjunct. Crest should form soon. Specific date July 30- Outer date August 08 2014.
July 26: Moon in Minimum Latitude
July 26: Jupiter in extreme declination
July 27: New Moon at 04:12 a.m.in Cancer
July 28 Venus opposes Pluto Crest formation within 2 days (July 30)
July 28:  Moon Apogee at 09.05 a.m.
July 29: Mercury enters Cancer at 04.31 a.m. Sun and Mercury will then be in the same sign. This means reduction in bullishness going forward in the immediate future.
August 01: Venus forms a waning trine with Saturn on.. Trough formation within 11 days
August 01: Venus forms a waxing square with Uranus. Trough formation within 9 days.  
August 01: Same day, Mars squares Jupiter. Trough formation within 10 days.
August 05: Venus squares Rahu
August 07: Mars waning trine with Neptune reversals within 5 to 7 days. Both trough and crests possible.
August 08: Sun conjuncts Mercury. On July 28th, the combust zone begins.
August 08: Same day Sun and Mercury are in waxing trine to Uranus.

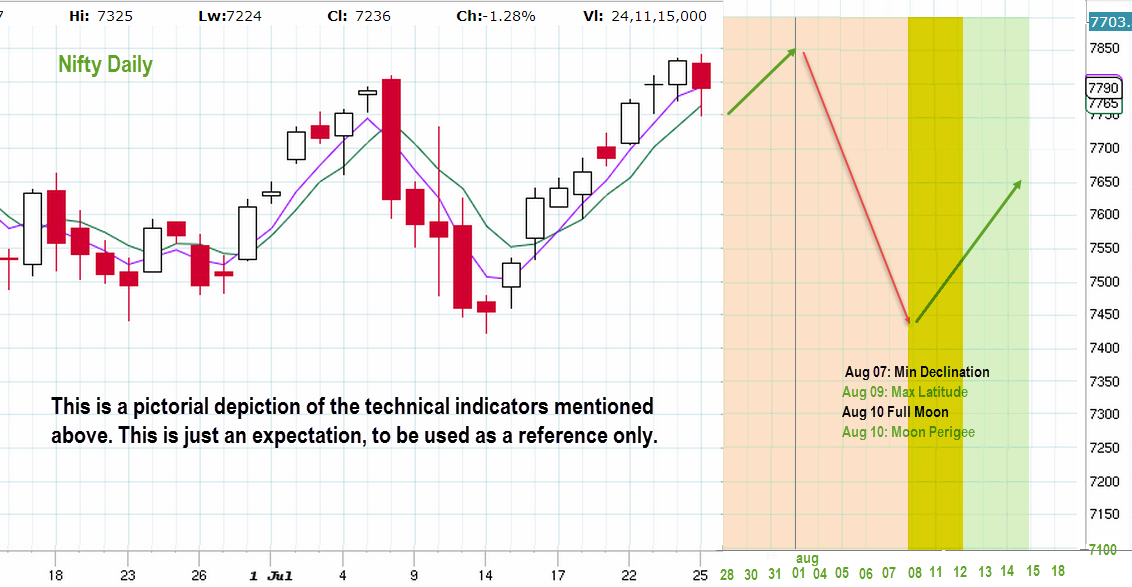
Summation of what I expect to happen is shown in the chart below. But then Iam still evolving this indicator. So use it with caution. Anyway, no trading without stop losses or on anticipation, right?

Instead of elaborating the above in words, I have put the net expectation in this chart...


To sum up,
we expect Nifty to continue its up move this truncated week. There may be a down move on Monday which can be bought into.From August 04, Nifty is expected to reverse.
That could be either the final leg of wave f of F or wave g completion. If so we need to confirm if the move takes Nifty effortlessly beyond 7722.Personally I think one more upmove is pending in Nifty, the final wave g of F.
So trade carefully and enjoy the effort!
Next week, we will examine some KP Astro analysis...
Thank you for being my beloved readers..    

Sunday, July 20, 2014

Nifty Astro Technicals July 21 to 25, 2014

For the long term we see that the 13 month cycle is quite important for Nifty and so the 13th month will be September 2014. 


Since time cycles expand and contract, we give an orb of +_2 months. We are approaching a crest of significant proportions in the next two months.
Of course, we continue to believe that the very long term trend is quite bullish.
However the weekly picture looks a little wobbly. It appears that Nifty wants to relieve some of its overbought pressure


The daily picture is quite different…
There seems  to be that some more upside can be expected here…

Let us look at the wave counts….

Nifty had technically surpassed and closed beyond 7660, at 7664.This marks the 61.8% retracement for the fall from 7809 to 7422.So the odds that Nifty is forming a flat from the top of 7809 is higher now. Price, movements on Monday should confirm the picture. If so, f wave of the diametric is just on. It had completed one leg “a” at 7422 and currently it is “b”. This b wave could retrace anywhere between 61.8 to 80% where it will be a weak b wave. If it retrace 101 to 123.6% it will be a normal b wave and anything beyond that it will be strong b wave. We expect b wave to behave normally and later on go back to the base or beyond, as wave c of f, from where wave” a started. If so, then wave g of the complex corrective will unfold later on as an upmove.
So we expect the bull move to continue this week with volatility. July 24th and thereafter have to be watched carefully.
A look at the short term cycles..
As per this chart, we see that Nifty is close to a reversal zone..

When can we see trend reversal changes?
For that,
Let us examine the Astro picture.
Whew! What an array of indications!
Saturn turns direct on July 21, 02:05; 16 a.m. Crest formation is round the corner.( 4 to 7 trading days)
Uranus turns retrograde on July 22, 2014.(4 to 11 trading days)
On 22 July, Tuesday at 12.19 pm, Mercury will be in full opposition to Pluto. Market could rise towards this date and time.
July 22: Venus in extreme declination at 10.14 pm
July 23 : Moon in maximum declination
On July 23rd, Moon will be in Magayeeram, in Taurus, with Sun in Cancer.                                     July 24: Declination extreme for Mercury
July 25, 02.30 am, Sun is conjunct Jupiter. Which means Jupiter is conjunct. Crest should form soon.
July 26: Moon in Minimum Latitude
July 26: Jupiter in extreme declination
July 27: New Moon at 04:12 a.m.
July 28 Venus opposes Pluto
July 28:  Moon Apogee at 09.05 a.m.
July 29: Mercury enters Cancer at 04.31 a.m. Sun and Mercury will then be in the same sign
Venus forms a waning trine with Saturn.. Trough formation within 11 days

This looks like the current uptrend could terminate by July 24 or 25, 2014.Then b would have been completed and the downward c should begin.

The next option is that the current upward wave movement be construed as wave g of the diametric.. In such a scenario, wave g has opened upwards and may continue for 3 or 4 days. But this count now looks improbable now.Closer to the New Moon, looks like an opportunity to create shorts, with stop losses.Last but not the least, allow price to move first in the direction of our expectation, before any trade steps are initiated.
Trade carefully!

Sunday, July 13, 2014

Nifty Astro Technicals July 14 to 18, 2014

Last week we were cautious because astrologically moon had more than one event surrounding it and technically we felt that wave e was maturing…
As expected we saw a reversal, some spectacular, gut swooping volatility and a seeming continuation of the downtrend.
Since we are close to or in the midst of a top formation, (we do not yet know, whether it is short term or medium term), let us re-examine the long term pattern (monthly chart) we saw last time..that of Cup and Handle.
“Although it is a discretionary pattern, the cup-and-handle offers the opportunity to capture large rallies. The pattern forms when a stock sells off (the left side of cup), consolidates (the bottom of the cup), rallies back to the original sell-off level (the right side of the cup), and finally pulls back (the handle). Volume can be used as a confirming indicator when the pattern has been recognized. Trading the pattern involves placing an entry order above the market when the handle is formed, and placing a protective stop beneath the handle.”


So, we can technically have a top here with Diametric wave F ending shortly and wave G beginning downwards, shortly. Such a   G, lasting several months, could pull down Nifty to the top line of Cup and Handle formation and form the classic pull back. This could take several months, and could well get us into the middle of 2015.Let us not forget that the single most factor of diametric formation is one of time equality, not price equality. The current F wave should mature in early September, having completed 13 months then. Even if we assume a G wave failure that could well take us into 2015.However the G formation also will have several ups and downs giving us many profitable trading opportunities.


So, the biggest up moves in Nifty are yet to unfold….
On the weekly chart, Nifty`s high was higher this past week and the low was lower. So was the close. Now this is decidedly bearish. Long weeks of overbought positions now look to unwind. In other words profit booking should continue. We follow the principle of sell on rises till the last sell gets negated.
We use the opportunity to move out of all speculative mid-caps and hold on to just the defensives.


In the daily chart,
The lower b-d channel line is now decisively breached. If 7442 goes, then we expect 7360 to hold for an immediate bounce, which could open up the final g leg of the second corrective in F.
Thus if there is a low formation this week, then we expect a bounce back. No anticipation, but just expectation.
Now after the upward g is formed also, Nifty can go through one more diametric formation involving another x wave. Since the channel is breached twice, that could be only a remote possibility. Which means if g tops out, and Nifty breaks the lower channel yet again, odds of G wave downwards having started will increase.
Faster upward bounce this week shall confirm that wave f wave is completed.
First corrective will achieve time cycle completion with the second corrective, by July 15
So, next week Nifty movement should be quite interesting.

In the 30 minute chart, we see the micro time cycle from the fall from 7800 levels nearly complete. This also corresponds with a tentative abc formation of the ongoing f wave of the second corrective.
Astrologically,
Volatility continues…..
Mars moves into Libra on July 14th.
Rahu also moves into Virgo, on the same date.
So does Ketu, from Aries to Pisces.
Venus moves from Taurus into Gemini.
Saturn becomes direct on July 20.
Uranus becomes retrograde on July 21.
This point to a fundamental shift in the investor and trader psychology. Apart from Jupiter moving into Cancer last month, the most important shift here is the movement of Rahu-Ketu axis from Libra-Aries to Virgo-Pisces.
Early morning today, Mars was conjunct Rahu, in Libra. And Venus was in trine to the Rahu-Ketu axis.
In short expect more volatility and also expect trend reversals in most markets.
Next critical time zone is between June 21 to 23, 2014.
Sun Mars square, Sun Jupiter conjunction and Jupiter Mars square will dominate in this period.
If any recovery happens this week, be watchful on the above dates. The trend could reverse downwards more forcefully then. If the downtrend persists this week, then expect a good up move in the period June 21 to 24.

As always, this observation is one of expectation and preparedness. We take action only when the Market Technicals tell us to do so. If we expect a down move and if the market breaks a key support, then we go in more confidently with shorts. If the market closes above a resistance, and we expect a positive move astrologically, we go long.      

Sunday, July 6, 2014

Nifty Astro Technicals July 07 to 11, 2014

So, after a long gap of 11 months, this blog is getting activated. Markets of course are forever and they have continued to churn out profits and losses to the millions who follow them...  
Looking at the long term charts of Nifty, we see a powerfully bullish picture emerging...


Minimum target from the Cup and Handle formation is 10,471.Of course the path will be full of ups and downs and all downs become important for investors because they represent buying opportunities.

From a Neo Wave perspective also, the current situation is quite important ...


In the month of August 2013, wave E ended and wave F had began upwards in the form of complex correctives, well channeled. That they are so well channeled makes them complex correctives rather than impulse waves.First corrective was a diametric and it appears that the second corrective also may be one. This means the current upthrust of "e"  could end in a few days and a down move of "f" could start. This may be followed by another final upmove of "g".Then there could be a larger correction which could bring Nifty down, outside the channel and consolidate. End of "G" should mark the beginning of " Mother of all bull markets".
So ride the present upmove but be vigilant. The move is fast maturing and will produce volatility, associated with the f and g legs. Then corrections could happen..sometimes quickly.
Let us look at short term astro effects ...

We see most of the latest turning points happened when more than one Moon effects were present.The latest Moon declination and Full Moon was the start of this latest upmove.
Between June 11 to 13,there are four separate Moon effects. Saturn also in in it's extreme.


  Additionally Moon is in the midpoint of Uranus and Mars, on July 12.And on July 16, Sun triggers the Rahu Ketu axis.
So a minor correction should ensue, shaking out all weak hands.
All the best for the pre Budget and post budget markets to all my friends!

Disclaimer:Whatever given here is just my point of view. Acting on them is solely up to you.I cannot be responsible for profits or losses or lack thereof owing to actions based on these observations