Pages

Thursday, February 28, 2013

Astro Technicals for Feb 28 2013

Nifty experiences a bounce. Let us see if Fibos hold.Venus conjuncts the "dreamer" Neptune accounting for short term bullishness.


Wednesday, February 27, 2013

Astro Technicals February 26 2013

Nifty`s down trend got more pronounced today and we saw the break of December 2012 low as well as the October 2012 high..


We had been discussing these Astro aspects time and again...


Astro indicators look a little negative till March 04 2013.

Tuesday, February 26, 2013

Astro Technicals for Feb 26 2013

The charts are self explanatory. Trade safely please..


Sunday, February 24, 2013

Astro Technicals for Dow Jones Feb 25 2013

Since our markets are so tuned to Global Markets, I just thought to  have a look at the DJIA, one of the influential biggies.
Here are two alternate wave counts for the Dow..


Both of them add up to the same conclusion. There could be a short term correction followed by a big up move.Long Term RSI also indicates that there could be a correction to the mean levels of 50 in the near term.

Astro Technicals for Gold February 25 2013

The coming week could be important for Gold.
Internationally we will know which way Italy will turn..towards a continuation of belt tightening or towards more radical thinking of moving out of Euro or worse, a muddle through caused by an unlikely alliance of politicians of all hues, arguing incessantly with each other.
Investors don`t seem to be worried..the 10 year Italian bond is trading at a yield of only 4.4 %...it used be at 6% during more trying times recently.
If some semblance of stability returns, gold should see a continuation of its current slide.It the political climate turns volatile, then Gold could begin to reverse upwards.
If Ben Bernanke makes new noises of reducing QE or if economic reports point to an improving US Economy, then Gold is sure to continue its down slide.Alternatively S&P 500 could strengthen.
Speculators notwithstanding, what is of importance is to see if physical  buying of Gold will continue..
Key markets such as India and China have seen reduction in physical buying, either due to economic situations or due to Government restrictions.
Here is the technical picture of Gold..

The current down trend looks like wave 4. It may continue till end of May 2013 and thereafter we should see another bull run for Gold, taking it beyond 33700.Thereafter Gold could see a multi year decline...Will the yellow metal crazy investors finally decide in favour of equities?

Saturday, February 23, 2013

Nifty Astro Technicals Feb 25 to March 01, 2013

Last week we expected a low leading to a base formation and then an up move towards Feb 26, Full Moon.

Here is what happened. Nifty bounced and just one day after Saturn retrograde, it had topped out and had three continuous days of decline.The up move which we had expected to Feb 26, is yet to materialise.  Since Monday is a day ruled by Ketu star and since Moon is in Leo, we may expect the bounce to happen on Monday. Global cues are also positive as of now.
However February 27th, with Moon in Virgo,and a Full Moon Deviation period running it would be prudent to watch the market and get out of short term longs.From then till Moon is in Scorpio, we may see the down trend resuming. That also happens to be March 04, 2013.
This date has a technical significance.
Let us see the technical pictures...

Twiggs Money flow Indicator has turned down quite significantly on weekly charts. With the negative divergence beginning to play out, this down trend has some more legs to go, short term bounces notwithstanding.
Let us see the wave counts on the daily charts.We can see the down trend has just begun..The larget boxed in terminal pattern is yet to play out.


However, in the hourly charts, the terminal formed by just the fifth wave alone, has satisfyingly played out and we have reached the 5850 area. Maybe we may go down to 5825 zone before we have a bounce now. Or the bounce may happen  from wherever we are....


Truth of the matter is that all such bounces need to be sold into and we wait for Nifty to move to 5500 levels.
Negativity is accentuated by the swarm of planetary aspects this week, notably the Mercury-Mars conjunction trine with Rahu and Sun& Moon  square Jupiter.
Since Jupiter is still in Taurus, we may expect the market to recover one more time  towards 6000+ once it has reached the 5500 levels.
Post Budget should be an interesting scenario.
Since the planetary aspects in the coming two weeks are quite treacherous including but not limited to Mercury retrograde, it is very necessary that all positions be covered with stop losses. Also double check your buy or sell orders, for quantity and to prevent wrong entries.


Sunday, February 17, 2013

Astro Technicals for February 18 to 22, 2013

Indian stock markets have entered a pronounced down trend last week.Third Quarter results are nearly over. Several companies had given less than desired results, perhaps expected due to the worsening macro economic situation.The next important cue for the markets are of course the Annual Indian Budget and of course cues from around the world. Since we are focused in Astro and technical analysis only, let us see what we could glean from our charts.
First we look at the technical picture followed by Astro charts.
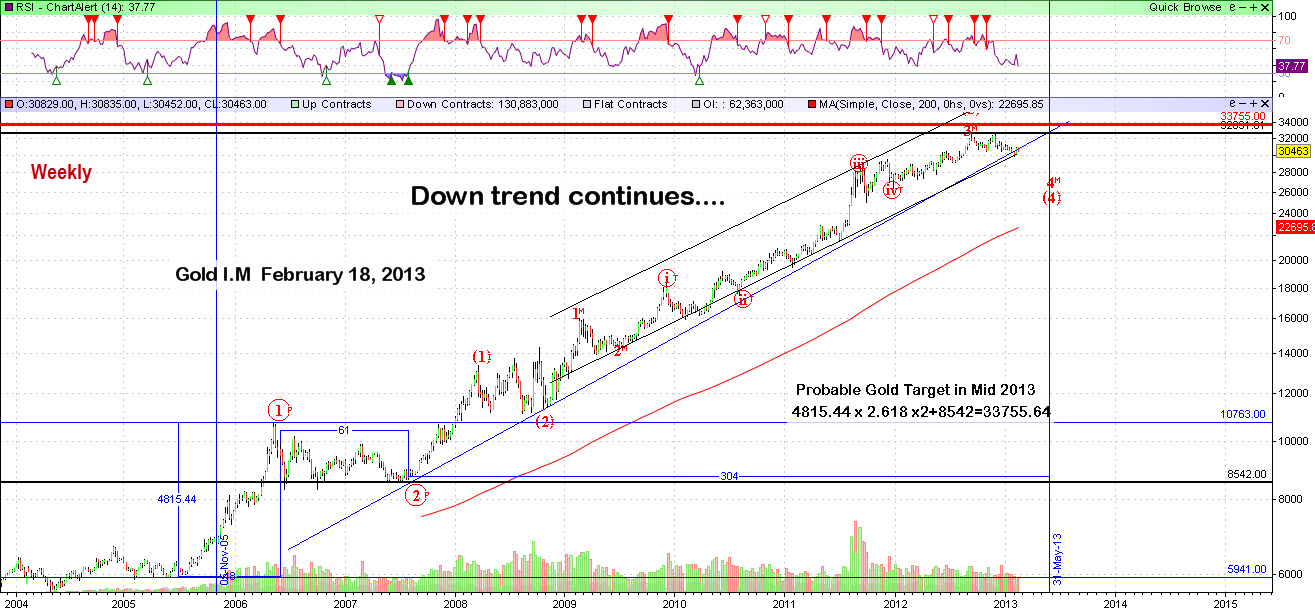
Here is the broader picture with wave counts....

So as per Neo Wave Analysis Nifty should weaken by another 300+ points before the first target of 5548 is reached.Target date March 04, 2013.It is fascinating to see whether this projection will come to pass.

  This True Strength Index is of the same period as Nifty Daily above.As can be seen  it has begun to enter the over sold zone. However in the past it had shown tendencies of moving up to zero line and then retreating whenever Nifty gives a bounce.
 Markets rarely go up or down vertically and these interim movements can be profitably traded if we are vigilant.
Let us look at a Pitch fork chart...

It can be seen that the zone 5815 to 5845 is an important support zone.Since Nifty is oversold may be a bounce may happen at these levels..

Twiggs Money flow is exhibiting a small positive divergence which needs a confirmation from the price.Profit taking in the form of short covering could emerge which may account for the bounce.


If we take a Fibo analysis from the beginning of wave 5, around December 20, 2012, and look at the retracement picture, we see Nifty moving down to the 50% point at around 5829.The red Fibos represent a reverse bounce in the direction of the long term trend and we see 6000 emerging as an important resistance point. 6000 or thereabouts are also close to the median line of  Bollinger Bands. BB has widened in its extremity and so probably soon we will see a bounce into the centre of the  Band.
Now February 26th seems to be an important date..Why? Because of some Astro reasons...

Let us see the Astros now....

February 26th is an Aquarian Full Moon.Moon moves between the First Quarter and the Full Moon between February 18 to 22, in the signs of Taurus, Gemini and Leo. The whole of Cancer gets nullified by Saturday and Sunday next.Full Moon occurs when Moon is in Leo.
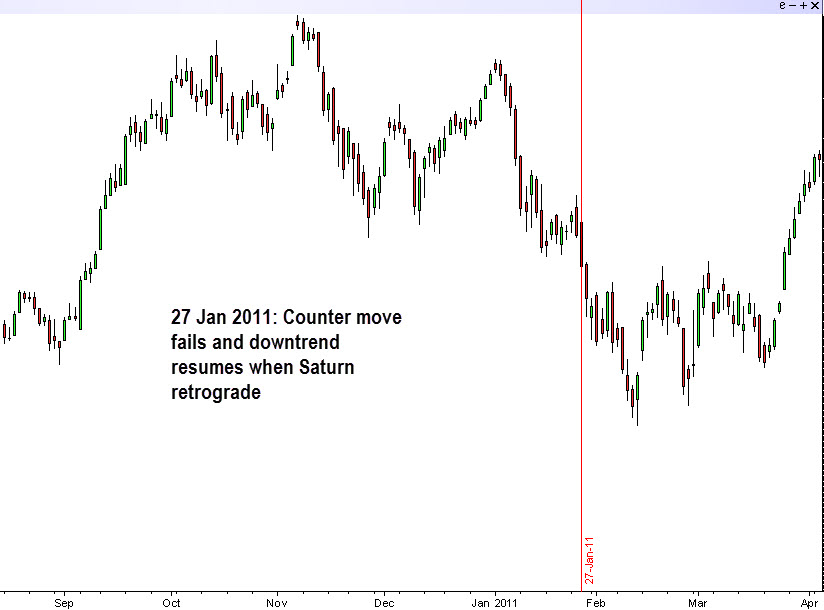
On February 18, 2013, which is the First Quarter day, Saturn turns retrograde.This is an important signature during which we have seen reversals in the past. A detailed analysis was posted two weeks ago, which may be seen in the archives.
On February 19th, Moon reaches Minimum declination and also sees Moon at the maximum distance from the Earth.
So we expect a low to be formed on Feb 19 or 20 and then Nifty should move up some what.


As can be seen in the chart below, every time we have a Sun Neptune conjunction, a reversal in on the dot or close by on either side of the conjunction date.Venus also enters Aquarius and trines the natal Jupiter and Saturn.
Our reading is that after a base formation or low formation for the first two or three  days of the week, we may see a moderate up move towards February 26.
Since Sun and Moon square Jupiter  on the New Moon day of February 26, down trend could resume post February 26th.  


Here is an interesting aside. When was the last time that Saturn was in Libra and simultaneously Jupiter was in Taurus? It was 60 years before, in the 1950s! 1954 to be precise. 
Since we did not have Nifty or Sensex then, I did a little snooping around for a Dow Jones chart.Here it is! So Iam a little more convinced that the long term up move may continue till May 2013, terminals not withstanding.


Markets have however entered a treacherous zone. It is highly hazardous to our Financial Health to venture out to swim in the markets without life jackets. These jackets are also called as Stop losses.
Happy trading! 


Wednesday, February 13, 2013

Let us have a look at State Bank of India`s charts. It is about to announce its Third Quarter Results tomorrow, on February 14, 2013.
We look at the long term monthly charts first.We see it is in a down trend .he question is whether B is over and C has begun? If so we are looking at a support level of 1870 to 1900.

SBI Monthly February 2013
We also note that the RSI has turned down from middle of the chart.This normally portends a decline.
Weekly MACD also has turned down signalling an imminent down trend...

On the daily chart, BX Trend line seems to have been violated.61.8% Fibo level is around 1950.

What does Astro say?


On February 14, 2013, both the transit Ascendant and the Moon are in the 12th house.Not a nice place to be. SBI is undergoing Mercury Dasa Jupiter Bhukthi. Jupiter and Mercury are in inauspicious 90 degree formations both in Natal and Transit charts. 
It looks like there is some more pain in SBI for the time being.

Sunday, February 10, 2013

Nifty Astro Technicals February 11 to 15, 2013


We recall the major aspects and Astro actions of the past month to take a holistic view of Nifty`s movements.
1. January 16, 2013: Rahu enters Libra
2. January 17 2013: Venus conjunct Pluto and square Uranus
As expected in 7/8 trading days, Nifty topped out at 6111.80 on January 29, 2013
3. Jupiter turns direct on January 30 2013. Nifty had topped out just a day prior.
The next major medium term impact aspect is Saturn turning retrograde on February 18; 2013.As discussed in the previous posts, Nifty generally rises into the phenomena before turning down again after the event.
Let us not forget that Jupiter is still in Taurus. So I do not expect an intermediate down trend to commence. Rather after a shake out of weak hands, Nifty should make one more attempt towards 6000 or 6100.We will shortly see how the waves account for such an observation.
For the current week, between February 11 to 15, Moon is travelling in the houses of Aquarius, Pisces and Aries.
Historically, Nifty hits a high, when Moon is in Pisces, especially when she is the phase between New Moon and First Quarter.
So, this then is the Astro expectation:
February 11 is a high impact day, with several lunar signatures coming up. New Moon effect, Moon in Max Latitude, and Saturn getting into extreme declination. Moreover we have other signatures all adding up:
Saturn Venus square
Sun square Rahu/Ketu axis
Mars square Jupiter
Mars and Mercury conjunction
So Nifty could decline some more, possibly to 5800+ levels and then bounce to 6000 or 6100 by February 14/ 15. But then with Saturn retrograde looming in, this will again get sold taking Nifty down below 5700 possibly. But this is expected to happen only after Saturn becomes retrograde, post Feb 18, 2013.
Continuing bearishness has changed the counts a bit and they are being
presented here, afresh.  


Conclusion: Short term trend is down, both with Astro and Technical understanding. One more bounce could be expected. A major down trend does not appear to be on the cards, since Jupiter is still in Taurus.Saturn retrograde may coincide with the abc corrections currently going on. 

Wednesday, February 6, 2013

Nifty Astro Technicals for February 06 2013

See the yellow band in the accompanying chart. It represents a terminal impulse move and a faster correction almost to the roots at 5940. Any up-move from here should count as the fifth of the fifth wave.


Astrologically also the charts are interestingly poised..


Tuesday, February 5, 2013

Nifty Astro Technicals February 04 2013- Saturn stations

On February 18, 2013, Saturn becomes retrograde in Libra. This is another powerful station in Financial Astrology.
Let us see how our markets behaved in the past. Since we have to go back to the 1980s, Iam using BSE charts here...
Saturn had last transited Libra, 29 years before..in 1984...
Retrograde station had led to an immediate downfall.
Let us look at recent times..


Planetary aspects of March 01,2013 indicate caution, especially with the Saturn retrograde, in the back ground.

Monday, February 4, 2013

Jupiter in Taurus- direct and retrograde station effects 2013

In the past, we had seen how Jupiter takes up the trend when it enters Taurus and then amplifies it and pushes the market in the same direction, either up if the trend was up when Jupiter started off in Taurus or vice versa.
Last time Jupiter was in Taurus was in June 2000- 2001..
Let us look at a couple of charts....


This weekly charts tells us that the trend which was negative when Jupiter started off in Taurus, was continued throughout.
What happens when Jupiter turns retrograde and then turns direct, when in Taurus?


In Taurus when Jupiter became retrograde, within three weeks, it started a strong counter trend move.
When Jupiter became direct,within two weeks, it started a trend which was strongly in the direction of the major trend.
Now let us look at 2012-2013....

In Taurus, when Jupiter became retrograde on October 05 2012, it immediately started a counter trend.


Going by past form, then Jupiter ought to start a new up-trend now, especially since Nifty was falling into the direct station on January 30, 2013..Price movements are also likely to remain within the maroon trend-lines.In other words, the downside from here on is only up to 5940, which is the level at which the lower maroon line intersects.