Pages

Sunday, September 30, 2012

Astro Trading Nifty- October 01 to 05, 2012

This week we are entering quite a crowded stellar zone with several significant astro phenomena beginning to come up.Some weeks back we had discussed how the absence of Jupiter is not giving the full filip to the Banker`s action across the globe.With first Mercury, and then Sun, have got into a square-opposition situation with Pluto -Uranus axis.Later this year,Venus  and Mars also will get into  this act-the debt issue still looks complex and eluding a solution.
The important long term saving grace is supplied by Rahu and Saturn.Rahu is moving in Jupiter star now and has caused the commencement of  its 18 year economic cycle. When Rahu comes into ints own star, later this year, markets may  see significant corrections. This could coincide with exalted Saturn turning retrograde.Venus and Sun both passing through respective debilitation points.It looks like we have trouble brewing in November for markets world over.
However, October should be good..
Let us see the transit chart cast for October 01, 2012, the month beginning. Lagna falls in Libra, ruled by Venus. Venus is in the tenth house, in Ketu star.Ketu itself is in another kendra, the seventh.Seventh lord,Mars is powerfully positioned in the First House or Lagna.This provides great energy to the markets.This may be translated as volatility.The next Kendra house, the fourth has Saturn as its owner and Saturn is in the twelfth- not a great situation. But being in exaltation and being in Mars star, it has great propensity to do good.Moon in the sixth,Rahu in the lagna,Sun in its own house in 11th all bode well for the markets.


What then are the negatives?
Jupiter positioned in the 8th,Mercury in the 12th and Uranus in the 5th are not very good. Mars forming a conjunction with Rahu is also bad.This conjunction also forms an unholy alliance with Venus and Neptune. See the thin red lines. This formation is called a Grand Square and it spells trouble.
What kind of trouble?Rahu- Mars conjunction is happening in Scorpio ruled by Mars and a water sign. This signifies trouble in the Middle East. Since Venus is square to this formation, this trouble can have economic ramifications, affecting markets. Since Neptune is involved, such economic pressures could come from the supply or price of crude.
Since Moon will soon form an opposition to Mercury ( which has moved off its exaltation and is in the fag end of Virgo and hence weak), we may expect economic news which will have emotional angles, like for instance, higher taxes and hence public dissatisfaction or austerity measures leading to protests.
But the positives seem to out weigh the negatives.
Moon`s declination picture indicates that the market could get into a green zone from October 04 onwards.


October 01, which is ruled by Mercury could see prices softening, but October 03, ruled by Venus could see Nifty improving.October 04, is a Sun day and may be mixed. Mixed because Sun`s heat is cooled off by being in Moon`s star.October 05 may see profit taking because of Jupiter Moon effect, but that is only an opportunity to take on more longs and not to go short.
What do the waves say?
See the charts..They are self explantory:


We shall examine Gann applications in more detail in future posts. Here is a chart of Weekly Nifty Futures with Gann levels:


Thanks a lot to all my friends for your comments and encouragement. Have a great month of trading!
Be prudent, do not anticipate, wait for market to show the way,have stoplosses always and you will become happy! 


Thursday, September 27, 2012

Nifty Astro Technicals: Intra day updates of Astro Trading- September 26, 2012


With a continuous third day fall, the internals of the present up move from September 05, 2012, have changed. It appears that the Minor fourth wave is not complete.3rd seems to have been completed on September 17, at 5652.20.The ensuing correction was wave a and the big up thrust could be wave b. This means wave c is in progress.


We observe that wave b>wave a.
Also wave b>138.20% of wave a. In fact wave b did cover 1.578 the distance of wave a .It looks like an Irregular Failure is forming. If so wave c should not go below 5535.It is likely that wave c could terminate around 5603. In such an eventuality wave c and wave would be equal.
If wave c falls below   5535, then a little more time consuming triangle with 5 legs could be forming
However the post pattern formation ought, to be powerful, in the direction of the impulse.. .
Since Moon will be conjunct Neptune and squaring the Nodes, on September 27,Sun is about to get into a square with Uranus, Mars and Venus are squaring each other and Mars is slated to enter Scorpio on September 28, 2012.                     .
These look negative. Corrections should continue over the week end.
Interesting to note that the astro formations were indicating changes in the wave form quite in advance.

Tuesday, September 25, 2012

Nifty Astro Technicals- Sept 25, 2012-Would this happen?

Currently Nifty is in a consolidation mood as seen on the daily charts...
Here is a Neo Wave possibility.
Could this happen?


Sunday, September 23, 2012

Nifty Astro Technicals September 24 to 28, 2012


Dear Friends,

I think there is need for some explanation about this blog and its intentions. Let me start with what it is NOT. It is NOT a pure astrology blog, financial or otherwise. It is a blog of Astro Technicals. This means we use the axioms, principles and derivations of Astrology, in tandem with refined Technical Analysis techniques, so that we get an idea as to what we expect the markets will do next. We do not have any bias or hang ups about any particular type of Astrology here. We will examine all techniques which have the potential of giving us an edge. Also there is no religiosity involved with Astrology here, because we consider the science and its applications here, as a pure scientific tool and nothing else.
Astrology techniques are explained in detail so that other people with similar skill sets and interests could apply them and point out errors if any. Sometimes more than one kind of technique would be examined. The purpose of course is not to confuse, but to obtain more clarity as to what works and what does not. Ultimately, we seek  to improve our shared knowledge so that all those who visit this blog are benefited.
We use Nifty mostly here because that is what I trade in most often. And truly there is no desire to look at too many markets because you can make all the money you want in just this one index, provided you operate systematically and professionally, without getting emotionally attached.  Having said that, in future we may examine other markets as well.
We begin this week`s analysis by having a summarized look at the Technicals.
On larger time frame, we are proceeding upwards in Diametric D. This had started from December 20, 2011, at 4531.This D is made up of 3 waves. A, B and C.
A ended at 5629 on February 22.
B ended at 4770 on June 04.
Since June 04, we are in C of the larger Diametric Wave D.
Now, C is an impulse wave with 5 legs. (1, 2, 3, 4 and 5).
Leg 1 was completed on July 11 at 5348.
Leg 2 was completed on September 05, at 5215.70
Since September 05, we are in leg 3 of wave C of the larger Diametric D.
Now, leg 3 is an impulse by itself! (This means it has 5 minor legs 1,2,3,4 and 5)
These 5 legs have been marked in the chart below. On September 20, we have completed 4 minor legs and we are currently in the fifth minor leg of Leg 3 of wave C of larger Diametric D.  Minor leg 5 may terminate at 5739 or 5792 or any point in-between. The values 5739 and 5792 are likely Fibonacci ratios.Please keep in mind that the value of Fib ratios are limited when the market is impulsing. The important understanding is minor wave 5 has not much distance to go.( We will see the astrological correlation a little later.)

Now what is being said hereafter are probabilities (not predictions for God`s sake!).At every point price has to confirm our expectations or else we simply modify our expectations. This also means that for both wave expectations and astrological expectations, please always refer to the latest blog posting. Only in the latest post will we be able to modify our thought output based on  unfolding market actions.

Wave 4 of C may come down to 5475 or 5500 range. Since Wave 2 was a complex formation, wave 4 may be expected to be simpler. But this is a relative phenomenon at best. Thereafter we may expect to see Wave 5 of C, the top of which ought to be the culmination point of Diametric D. The correction from there which is expected to unfold as Diametric Wave E could be quite lethal. The entire diametric sequence which began from January 08, 2008 is a corrective pattern. It may end with the waves F and G, after E. After that we may expect a true bull market of the century to unfold.
As short term traders who wish to make money steadily, we need not think so far out, right now. We take it week by week as it unfolds, protecting our capital and increasing our profits step by step. The charts below are self-explanatory:


Let us look at the astro correlations or lack of it:
On September 24, Moon is in Venus star. It moves through the subs of Mercury, Ketu and then moves into Sun star by close. After some hesitation in the morning till about 11 am, Nifty should move again and close positively.
On September 25, Moon is in Sun till about 12 noon. Then Moon enters Moon star.Moon is also in Capricorn.So it is probable that the market may decline from here on.Conservative traders may switch off longs, before 12 noon.Depending on the force of  decline, if it ever happens, only can we decide to go short.


On September 26, Moon continues in Moon star till 11.50 am. Thereafter Moon is in Mars.Moreover Moon is close to trigger the trine between Jupiter and Mercury.So Nifty may try to go up.But mind you, at 20.56.48 hrs on September 26, Moon is in the mid point of Uranus and Pluto and opposite to Venus. So this day may be used to get out of longs created a while ago. Negativity is increasing fast.
On September 27,Moon is in  Mars till 12 noon. Mars is  in Jupiter star, which is negative.Rahu is in Saturn star, which is positive. I do not expect any great fire works either way here.In other words Nifty could stall here without any positive conviction or most possibly, go down. Tonight, Moon would be crossing the Celestial Equator. And Mercury and Uranus declinations are  becoming  extreme,To top it all, Mars and Venus are in a negative square formation.   
On September 28, 2012, Moon is in Rahu till 12.33 pm. Thereafter Moon is in Jupiter. Moon is square Jupiter. Jupiter is in Moon.And the lunation effects will be in full force.So a pretty consistent decline is what is expected.In fact we may close the week negatively.
Putting both studies together, we feel, that we should be extremely cautious with longs till September 25 12 noon.We may start taking profits and by September 27, afternoon, looking at the market situation, if it exhibits weakness we take a cautious sell position.On September 28, if the markets moves down, convincingly, we increase our short position, with stop losses, of course.Wave wise we should then be in Wave 4 of C. The next reversal zone seems to be sometime around October 04, 2012, when Mars-Rahu conjunction is trigggered by the Moon and is completed.In other words plan to carry shorts till October 04, or till the markets say otherwise.
Happy trading with stop losses, of course! 


Thursday, September 20, 2012

September 16 2012- New Moon chart of Nifty

Here is the September 16 New Moon chart of Nifty.....
Sun, Moon, Saturn and Mercury are the ruling planets for the period September 16 to October 15, the next New Moon date.
Here is the signification table:

Three of the four significators are signifying 12th house, which is a house of reduction in values.
Sun is the sub-lord for the fourth house and Venus is the sub lord for the tenth house. So Sun should be involved in a low point and Venus must be involved in a high point.
Look at the above chart. Moon is positioned at Moon star in Saturn sign.at 13.18 hrs on September 25. It will be interesting to see if this is the low point for the current New Moon Cycle. Any way if the market reacts in this week we know when to at least expect a reversal upwards. Of course we will act only if price confirms.
Now let us look at this chart: On October 05,Moon, in Venus house, in the tenth is in Moon star at 15.08 hrs. So this could be a high point. ( Remember we had expected Venus is to be involved in a high point? Well, Venus owns the sign Taurus, where Moon is placed on October 05, 2012.)
Here is another alternate chart for a New Moon High...

On October 09, Moon is in Saturn star, in Moon`s house of Cancer. Since the Ruling planets agree, will we be having a double top attempt? Lord only knows but it is sure exciting to find out.

At the risk of becoming a bore, let me repeat this. After getting badly burned in the 1990s, I have never traded without a stop loss. Every theory in the world may look exotic and attractive, but always allow the price to point us in the right direction. If you are with me in this, then we may safely examine several new methods of market analysis...

Nifty, the bigger picture 2012-2013


Today, September 19, 2012, at 11.33 am by Mumbai coordinates, Uranus and Pluto are getting into a square aspect once again, this year. This is the second of seven aspects. It would be an interesting exercise to speculate what this means to the market.
Before that, let us see how Jupiter`s movements have affected our stock markets, first in the recent past and then in the real past…
Please see the chart below: Every time Jupiter was in Leo or Aries or Sagittarius and Aquarius, we had significant top formations. Jupiter right now (September 19) is in Taurus. It has to move through Gemini and Cancer to reach Leo next, which could be sometime in the third quarter of 2015.
Interestingly the last of the Uranus- Pluto transitions happen on March 17, 2015.So progressively our Governments and Bankers do the same thing- provoking the Economy with more and more bailouts and QEs, with each one working less and less compared to the previous one, until the whole thing falls flat on its face and the system corrects all the ill doings once and for all. This 2015 mega top out also falls within the 8 year stock market cycle which we have ( 1992-2000-2008-2016) and with Jupiter in Leo then, astrology also seems to agree. 


If we examine from the 1980s, apart from Sagittarius, Aquarius and Leo, we had a couple more occasions where Jupiter in Gemini and once in Cancer did give us intermediate term corrections. But always the big tops have come with Leo, Sagittarius and Aquarius.
Armed with this knowledge, we deduce then, that the Uranus Pluto squares will work underground or behind the scenes, changing the very rules of the financial games we all play and ultimately manifest them during their latter squares.  
Jupiter enters Gemini only on 31 May 2013.He enters Cancer on 19th June 2014 and Leo on July 14, 2015. So the long term upward bias will continue with a few significant corrections in between.
Our Uranus- Pluto square being the fundamental underlying aspect, is bound to be involved in many of the significant downturns during this run up, upto March 2015.Two other factors which work in favour of bulls is that,
1.    This Uranus- Pluto square is a waxing square- this means the underlying natural principle is not one of total destruction and then rebuilding, but one of massive change for rebuilding quickly.
2.     Rahu, on August 30, has entered Saturn star and Mercury sub in Scorpio. This means the 18 year previous economic cycle has come to an end and on August 30, 2012, a new cycle has begun. This cycle will top out in 2021.
With this back ground, now let us look closely at today`s Uranus- Pluto square and see how things are likely to pan out.

On September 21, Mercury is square Pluto. On September 23, 2012, Moon will conjunct Pluto and activate the Mercury square. Watch the black arrows on the right hand chart. But with Mercury moving into a trine with Jupiter and Mercury moving into an exalted position soon, the bearishness of Uranus- Pluto- Mercury square and opposition will be slightly muted. And with Jupiter on a sextile path with Venus, we can see the bullish structure getting shaken by adverse communication. Markets may not face big sellouts. In fact post September 24/25, markets may improve.


On September 26th, Moon and Venus are in the mid points of Uranus and Pluto and this will cause the markets to fall again. By September 30, Moon is conjunct Uranus in Pisces. When Moon opposes Sun, in a Full Moon the square gets triggered. Meanwhile Mars and Rahu become conjunct and this conjunction is squarely aspected by Venus.
Markets should correct as per this formation, a little more than earlier. .


By second October, several aspects come together and the correction should weaken the markets further.


As usual trade with stop loses and unless the price moves as per expectations please do not open fresh positions.


Tuesday, September 18, 2012

Nifty changes patterns , September 2012

Nifty crossed 5634 on an intraday basis, went up to 5652, before closing at 5610. Automatically the terminal impulse we had been assuming so far, gives way to a Trending Impulse in the Nifty, wave 2 expands to form a modified wave 2 ending at 5217 which also is the beginning of wave 3.

Here is the chart.....


Here is the weekly chart....
And the hourly....
Since we are in a reversal time band, it is prudent to book some profits and wait for the next leg up, which could be early next week.


Sunday, September 16, 2012

Nifty Astro Technicals for the week September 17 to 21, 2012


Starting from where we left off,   on September 10, we had said,
“Nifty is in the process of tracing a leg of impulse wave 5 of C of diametric D, which had started from December 20, 2011.
As per Neo Wave, leg b has great probability of touching 2-4 trend line in the coming days. There could even be a break of the trend line. Assuming the same angle of ascension, between lowest point of 2 and top of 3,we look at a probability of c ( and therefore the top of 5) at around 5525.Since the first leg of retracement should take the same time or similar time as taken by Nifty to move from 4 to 5, we have the retracement line as shown, returning to 5217...
If wave b deepens, then the classic 2-4 trend line may come into play...
All look as interesting possibilities. Looks like the Fed announcement of September 12 may cause initial euphoria followed by a reality check... 
Here is what actually happened…
·         Global markets rallied after the Fed said Thursday, September 13, 2012, it would start a third programme to purchase $40-billion per month in mortgage-backed bonds—known more commonly as quantitative easing (QE3).
The US central bank added that it would continue with the scheme until it saw substantial improvement in the jobs market. It also pledged to keep benchmark interest rates at ultra-low levels until at least mid-2015.
The news sent the euro soaring above $1.31 to a new four-month high. The weaker greenback boosts dollar-priced commodities, which become cheaper for buyers using stronger currencies, tending to stimulate demand.
Analysts said dollar was being hit by the prospect of higher US inflation caused by the stimulus. The euro also won a boost this week from German court approval for a new 500-billion-euro (645-billion-dollar) firewall and fiscal pact, clearing a key hurdle in solving the Eurozone debt crisis.
·         Government of India, on September 13, 2012, raised the diesel price by a steep Rs 5 per litre and capped the number of subsidized cooking gas cylinder to six per household a year, decisions that will rake in an additional Rs 20,300 crore to the oil companies
·         Stepping up on the reforms front, the government, on Friday, has approved Foreign Direct Investment in aviation and multi brand retail.
·         The government has allowed foreign airlines to buy into Indian carriers. The move will now allow foreign airliners to buy as much as 49% of the local carries and pump in funds.
·         FDI in multi-brand retail: Almost as a challenge to opposition parties and allies who are opposed to the move, the government has also approved upto 51% FDI in multi brand retail.
·         In a major decision to liberalize the broadcast sector, the government today  ( September 16, 2012) decided to raise FDI cap to 74 per cent in various services of the sector, except the TV news channels and FM radio where the cap of 26 per cent will apply.
.Opening the week at 5361.90, Nifty zoomed to end at 5577.65 on Friday, September 14, 2012.
Have a look at the volume changes!
Let us get to our analysis and expectation of what next…
Since the prime mover had been the FOMC Decision, we start from the US. 
Let us look at this QE programs from an astro point of view first.


So planetary signatures were signifying progressively weaker results for the QE series. In addition with a potential, bitterly fought and close election on the cards for the US (Elections will take place when both Jupiter and Mercury will be retrograde.)Moreover, in January 2013, the new US President will be forced to address the issues of expiring temporary tax cuts. Deep, across the board spending cuts to reign in the ballooning fiscal deficits will kick in automatically.
With Mercury, Sun and Venus poised to engage Uranus and Pluto in their square formation, this euphoria could come down much sooner than expected.     
 Let us look at our own charts, closer to home

 
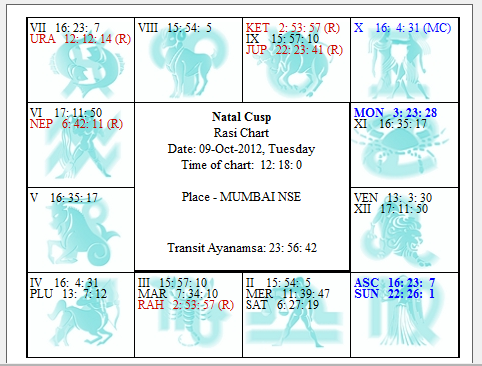
We have here the natal chart of India on its verge of Independence and the transit chart of September 14, 2012.The current dasa situation is also shown.
Amazingly we find Jupiter has moved to the Lagna position here also. See the arrow marked “a “.India is currently going through Sun Dasa, Saturn Bhukthi and Ketu Antara. India`s   Lagna lord is Venus. And Mercury is the lord of 2 and 5, houses of income sources and stock markets. The decisions for accelerating reforms were announced when Sun was in the fourth. In Leo. Soon Sun will move to Virgo and then to Libra, which is a debilitation house for Sun. Venus also is moving towards Virgo, where it gets debilitated. The Government has got this boost of energy possibly because Mars has moved into the sixth house and is becoming conjunct with Natal Jupiter. Antara lord Ketu is moving in its debilitation in the 12th.Saturn, the Bhukthi lord is in trine with Neptune, the lord of deception and unreasonable hope.
So apart from the jargon, what do we understand? When Mars moves into its own house Scorpio, the opposition gains strength. When Mars conjuncts Rahu, issues may reach a crescendo. Will the Govt fall? Not likely, because the Bhukthi lord Saturn is gaining strength of exaltation. Also Mercury is in Virgo, moving towards its degree of exaltation.
So the euphoric rise could start tempering with a good correction following .But since the following antaras   Venus and Sun are good for India, the medium term outlook for our economy and markets, is positive.


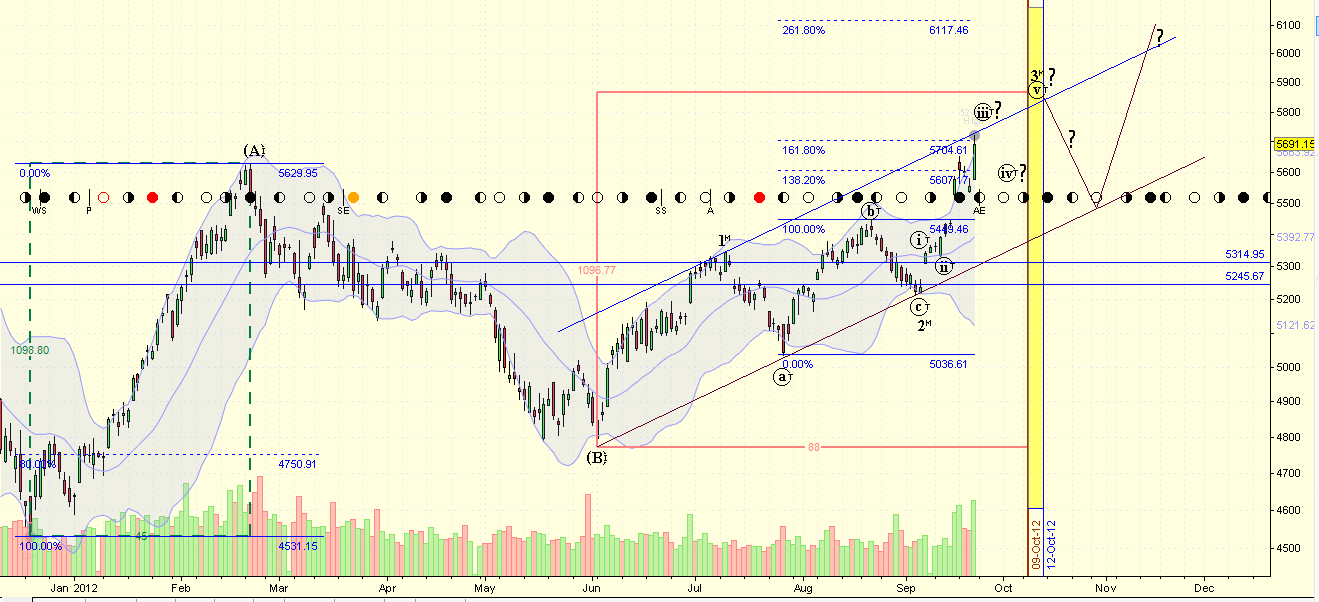
Looking at the Technicals,


Wave 5 has exhibited more power than we anticipated. It had crossed the 1-3 trend line with good volume. This does not mean the terminal impulse has to be immediate discarded. It has retraced more than 76.8% of wave 3 (depicted as AB) and is well on its way to touch 5629, which represents a major resistance. In fact 5634 represents the point beyond which we have to re-look at the wave counts.
Our expectation is that we may soon have a top which could be a leg of wave 5 and then have a pull back to b leg. As can be seen in the chart, we will also be entering into the reversal time zone from Monday onwards.
In short
A.    we may see a top, a correction and another rise to form a final culmination. If this culmination is beyond 5634, then the ensuing correction will end in the 5200 range. If so this will be a nice point to enter the market for an investment time period of up to January 2013.
B.    If the final top of 5 wave ends before 5634, then the correction will be fast and furious and will go back to 4700 levels.   
It would be a good idea to take profits within the next two days and then wait for a price confirmation for the corrections.
 
Here is a corresponding graph for BSE Sensex.


As usual please wait for price confirmation before taking any position commitments. In these columns I had indicated that the volatility will soon increase. It now has. Going forward it will increase even more with two way movements. It is absolutely essential that stop losses are employed regularly.
Have a great week of trading!