Pages

Tuesday, October 30, 2012

Nifty Astro Technicals for Oct 30, 2012


The fall from 5698 to 5645 yesterday was nearly 100% retracement of the rise from 5642 to 5698.Technically, one more up move towards 5720 range seems to be pending.

Sunday, October 28, 2012

A look at Nifty Cycles


Nifty Astro Technicals Oct 29- Nov 02- Elliott Wave Counts


Technically we are entering an important turn zone for Nifty. By October 26, we have completed 14 days from October 05 top. Since Wave 3 took 20 days we expect wave 4 to take more than 20 days to complete. This means we are entering the maturity zone of Wave 04.
So far we haven`t seen significant price damage. In fact Nifty just about managed to breach the 5641 level a couple of times, but had always scrambled back into the oscillating zone defined by 5722 range as resistance.
Despite serious declines in S&P and the Dow, Nifty had shown negligible tendencies only (so far) to go down. This suggests that once wave 4 completes we may expect a normal wave 5 and not a truncated one.   


Here is a chart on some interesting Fibonacci phenomena in Nifty….


Here are my preferred  minor wave counts for Nifty, shown on a 30 min chart.It should be interesting to see whether wave b of C will cross 5719, the recent top.Any way 80% retracement to 5700 should be a sell area.


Have a great week of trading.

Nifty Astro Technicals October 29 to November 02, 2012


We are entering into a rather high energy and impactful November month, astrologically speaking.

Starting with the effect of Sun Saturn conjunction, upcoming Mars- Jupiter opposition, Venus- Uranus and Pluto in a T- square formation, Venus into debilitation later part of the month, Mercury getting retrograde, plus a total Solar Eclipse –all beginning with a Full Moon on October 30 early morning.

Phew! The heavens are quite active this month! 

Let us take this one mouthful at a time. We concentrate only on the week, October 29 to Nov 02, 2012.
Have a look at the macro   position tabulation below. Particularly the column named as Orb effect date. 

The conjunction of a debilitated Sun with an exalted Saturn at 8*23’’ of Libra could make the market go up and form a crest and then cause a reversal. The reversal because of this aspect is expected by November 02.

Mars Jupiter opposition is also a powerful force which could impact the market by this weekend. Venus Pluto-Uranus effect is expected only later this month and so we skip them for now.

We must also look at the Natal Planets of Nifty to understand any specific impact.


As can be seen from the tabulation above, Mars, Jupiter, Saturn combinations with Rahu are currently not good for Nifty because of their opposition effect.
Rahu and Ketu in single star formations are good. That two major planets, Saturn and Sun are currently in Rahu star and such a Rahu is in trine with Natal Rahu of Nifty is possibly what props up Nifty, astrologically speaking. This is of course my reading and I leave the conclusions to my learned readers.
To sum up, aspects wise, Nifty should improve up-to November 31 and then continue its fall. But the improvement and the fall may not be substantial. But enough to benefit traders, let us add.

Let us look at the Declinations:


·   Venus Uranus decl- conj on October 29 should push the market higher.
     Venus crossing from North to South should start a decline by October 31.
    Moon at the highest northern declination is a turning point for the market. We may expect an up move  on November 05.


      Next, let us look at the Full Moon chart of Nifty.


New Moon chart says that Nifty may bottom out by Nov 07 at 11.21 am.
End of Wave 4?
Wave counts will be covered in the next post. Daily Nifty Astro projections will be covered in the daily post.
Meanwhile let us not forget that we continue to be in the lunar red zone. Trade cautiously. Wait for price turns to happen and let us avoid anticipations.

Have a great week of trading!  


Saturday, October 27, 2012

A long term view of Indian Markets- 2012


As short term traders we have our noses close to the market. Sometimes too close, so that we miss the trees from the woods. It is quite beneficial if we lift our heads from time to time and have a look at the broader view of the market. Of course we will go back to short term market analysis after this brief detour.
May of 1992 had marked a bull market peak. Sensex had moved from 1000 in the 1988s to 4500 in 1992. A fourfold increase.
Thereafter, a multi-year correction process started. It took the shape of a diametric ( A-B-C-D-E-F) which ended in 2001. Thereafter another multi-year bull market took off and raced up all the way to January 2008, taking Sensex from 2000 in 1993 to 20000 in 2008,- a 10 fold appreciation. From 1988 to 2008, Sensex had seen a 20 fold appreciation.


Let us look at the scenario after January 2008.Sensex had started a multi-year correction process. People had mistaken the recovery from March 2009 as a new bull market. But multi-year bull markets which have seen manifold increase in valuations, will always take a longer time frame for corrections.
Accordingly we are in the middle of the correction phase. We have completed A,B and C legs are currently we are in the diametric D. We still have three more legs to go E, F and G. How E, F and G will pan out is a matter of conjecture and we will know the entire shape only when we are closer to the formations. 


Now the Astro cycles indicate a contraction in the latter half of this cycle. So after 2016, when a top is very likely, the ensuing correction of G could be very sharp, just as we saw in 2008.
And in that terrible pessimism, the next new bull market could be born. By the time that one ends, valuations could easily be 20 times of what they are right now.
The main take away is that on a practical, larger scale, we are in a big and prolonged correction. But the legs are so large that a careful and astute trader can make money over and over again.
Meanwhile happy trading.


Friday, October 26, 2012

Nifty Astro Technicals for October 25, 2012

We had expected October 25, to be a "reversal -to -the -positive day and so it did. This despite negative clues and tell tale weakness in International Markets.
But global markets do move in tandem and sooner or later, the deviants fall in place.With lunar negativity strengthening, we may expect Nifty also to weaken from here on.
October 26th is the date, when the Lunar declination crosses from South to North.Moon is in Jupiter. We may expect Nifty to start reversing downward.


With today`s move there has been a rearrangement of the wave counts.


Blue zone is the minimum time period we expect current Wave 04 to travel. Post November 05, we should see the final fifth wave of C of Diametric D unfolding.

Let the new November series, be a very fruitful one! Trade safely, without anticipation- with stop losses!

Wednesday, October 24, 2012

Nifty Astro Technicals October 23, 2012


We had expected the lunar influence to cast a negative shadow on the market and it did.Nifty closed at 5691.40, 25.75 points down.My doubt was when Moon enters the sub of Venus which it did from  12:05:20 pm till 16:05:23 pm, beyond closing hours.Obviously Venus could have only a cursory influence because the Lunar effect is so negative.Briefly when Moon was trine with Jupiter,  recovery was attempted, but it only failed.
At the time of writing this post, I  looked at the Dow and had a shock-minus 254 points! Just shows how the negativity had increased throughout the day and affected other live markets.
October 25 is ruled by Rahu.Apart from Moon, both Saturn and Sun also are in Rahu. Transitting Rahu is in trine with Natal Rahu.Transitting Rahu is opposing Natal Jupiter.So a positive effect may be expected.

Moon reaches its maximum Latitude on Oct 24th. Sun and Neptune are in decl-conj .Effect is seen usually one day after. We have no trading on Oct 24.
So Oct 25 could be a reversal- to-the-positive-day. Further, Saturn reaches its farthest distance, during this time. 
Let us see the charts:
The red band tells us that we are in the lunar negative zone for the rest of October.So first observation, we are still in a "sell on rises market."
Nifty is seen hugging the 1x2 Gann Angle line. It will break the Gann Angle line if it crosses 5677 on closing basis.


It is also seen oscillating around the 23.6% retracement line, which is 5673.83.
Any break here will first take it to the 5641 support line and a further break will bring it to 5585 levels. This is also the next Gann support line of 1X3.
Any up-move from here on Oct 25 will face stiff resistance from 5751.
Volume is constantly reducing, from Oct 05 onwards.Nifty futures are still trading at a premium of about Rs 4/-. So no appreciable large scale selling has taken place in equities.Yet there is significant short build up in the futures.If the roll over is not significant there could be some short covering on Thursday.

At this point wave c appears to be a triangle also. The waves have become complex. We need to see how the next set of waves unfold before deciding whether a triangle or a diametric is forming in Wave 4 of Wave  C of larger degree Diametric D. 
Wave 4 has consumed 12 trading days so far, from October 05.Since Wave 3 had taken 20 days we need to look at a minimum of 21 days for wave 4. This means we have another 9 more trading days for Nifty in Wave 4.It looks like we have time for wave d and wave e also to be formed.
But then the most interesting part is to see these patterns emerge, is it not?

Meanwhile happy and safe trading ( where we don`t anticipate but wait for price to show us the way ) to one and all! 

Tuesday, October 23, 2012

Nifty Astro Technicals Oct 22,2012

This is what we had written in October 21, Sunday post.


"..... Red period continues throughout Oct 22. Nodes which are direct from Oct 18, become regular retrograde on Monday, Oct 22, 2012, at 09.00.26 am. Will this bring a small trend reversal?
09.15 am to 11.20.04 am, Moon in Sun star, is in the sub of Mercury. Natal Sun is at QC with transiting Mercury. Negative opening expected.
At 11.20.04, Moon, in Sun star, moves out of the sub of Mercury into Ketu. Negativity should subside.
At 13.33.55 Moon moves into Sun star, Venus sub for the rest of the trading day. Venus is. Caution: Natal Sun is square transiting Venus. Natal Venus is square transiting Venus.
At 14.15 Asc moves into Saturn sign, Mars star. Moon will be in Sun star, Venus Sub. Natal Mars is trine with transiting Sun. So markets should improve from hereon.
Oct 23: Sun and Moon are in the same declination. Moon is in Moon star. On October 23rd lunar negativity should continue till 12.30 pm. By 12, 30 pm, downward momentum ought to slow down. If it doesn`t then the day could be negative...".
Nifty did move up to 5721.55 yesterday, before closing at 5717.15.As of now, on October 23,10.48 am Nifty is at 5705 at -11 points.
By 12.05.20 PM, Moon will move into Venus sub in Moon star,Will the decline continue is an interesting Astro question. An important lesson coming up.  

In the daily chart, 5677 is today`s Gann Angle support price. Nifty looks unlikely to break this today.


In the hourly charts, 5720 levels look very strong, Nifty having approached this level, at least 4 times in the  past several days. Wave c also looks like forming a diametric with the present day movement as minute wave d.


Sunday, October 21, 2012

Nifty Astro Technicals October 22 to 26, 2012


Nifty`s wave 4 which began on October 04, continues to consume time without any appreciable price damage yet. In the bargain, the wave patterns are becoming complex and nearly useless from a positional point of view. Only the most nimble of day traders seem to be making money as of now. But then for followers of Elliott Waves, this is nothing new. Just trading the impulses and an occasional correction is more than enough to be satisfyingly  profitable.Complex corrections make us become more disciplined,enough to know when not to trade.
We continue with our analysis of Nifty movements


If Nifty breaks 5641 it would be breaking the baseline of the descending triangle as well as 1x2 Gann line.That would lead to 5585 levels.

Here are the preferred wave counts.Wave c of the corrective Wave 4 is likely being formed.


Astrologically, we are in the Lunar negative period for the rest of the month. Most important aspect this week is the conjunction of Sun and Saturn in Libra.
Let us look at this week, in detail:


Red period continues throughout Oct 22. Nodes which are direct from Oct 18, become regular retrograde on Monday, Oct 22, 2012, at 09.00.26 am. Will this bring a small trend reversal?
09.15 am to 11.20.04 am, Moon in Sun star, is in the sub of Mercury. Natal Sun is at QC with transiting Mercury. Negative opening expected.
At 11.20.04, Moon, in Sun star, moves out of the sub of Mercury into Ketu. Negativity should subside.
At 13.33.55 Moon moves into Sun star, Venus sub for the rest of the trading day. Venus is. Caution: Natal Sun is square transiting Venus. Natal Venus is square transiting Venus.
At 14.15 Asc moves into Saturn sign, Mars star. Moon will be in Sun star, Venus Sub. Natal Mars is trine with transiting Sun. So markets should improve from hereon.
Oct 23: Sun and Moon are in the same declination. Moon is in Moon star. On October 23rd lunar negativity should continue till 12.30 pm. By 12, 30 pm, downward momentum ought to slow down. If it doesn`t then the day could be negative.
Oct 24: Moon reaches its maximum Latitude on Oct 24th. Sun and Neptune are in decl-conj .Effect is seen usually one day after. We have no trading on Oct 24.
So Oct 25 could be a reversal- to-the-positive-day. Further, Saturn reaches its farthest distance, during this time.
On October 26, Moon crosses the Celestial Equator, from South to North. Moon in decl- conj with Uranus. By 11 am, Moon moves into negative zone again. So Nifty may end the week on a negative note.
On a Universal scale there are not many aspects to discuss. Sun- Saturn conjunction is expected to take effect from October 31.Venus Jupiter square aspect should end on October 22. Aspects of import are listed here.


Exact Date

Planets

Aspect

Orb

Orb Effect Date

Expected Effect

08 Oct 07:18:00
Mars-Neptune (R)
Waning Square
Within 5 days or 8-12 days
Oct 12 or 17-23.
Dual effect, but mostly crests.
09 Oct 13:27:35
Venus- Pluto
Waning Trine
Within 5 trading days. Sometimes 11
Oct 16 or 25
Crest formation-Medium term effect

15 Oct15:40:00

Mars-Uranus (R)

Waning Trine

6 trading days

Oct 23

Not very strong or consistent. Crest formation, mostly.

17 Oct04:53:35

Venus-Jupiter (R)

Waxing Square

3 trading days, sometimes on the day of aspect.

Oct 19

Good trading signature. Dual effect.

25 Oct14:04:45

Sun-Saturn

Conjunction with Sun nearly debilitated

5 to 7 trading days

Oct 31 to Nov 02

4% reversals. Mostly crests. But some dual effects also seen.


As usual we recognize all these are conjectures. We will wait for the price action to confirm or negate these expectations and trade accordingly.
Wishing you all the very best, of what this festive season  has to offer!


Friday, October 19, 2012

Navratri


Nifty Astro Technicals for Oct 19, 2012

October 19, 2012, is the expected Lunar Reversal day.Please refer October 14th post for a detailed Astro analysis.
Let us look at the charts as of today:


Here are my preferred counts:

Wave 3 which started from September 06, 2012, had taken 20 days for completion. Wave 4 should therefore take a minimum of 21 days for completion.It has so far seen 9 days  of action as Wave 4.Major part of wave c, and possibly wave d and e are remaining, if Wave 4 traces out a triangle. If it is a diametric, we may see two more additional legs, f and g.
Sun-Jupiter waxing trine of October 09, will mature on October 19.This is an aspect generally associated with crests.Venus and Jupiter had also formed a waxing square aspect on October 17.This signature also may have its effect on October 19th.

Tuesday, October 16, 2012

Nifty Astro Technicals for October 16 2012


After rising for 20 trading days from September 06, Nifty has corrected for 6 days so far. From October 05.It looks in all likelihood that Nifty may get into a 3-3-3-3-3 triangular corrective mode, with each leg becoming smaller than the rest. Triangles are generally lack lustre and difficult to trade from a positional trade perspective. Since Wave 3 had consumed 20 days Wave 4 should consume a minimum of 20+ trading days. We enter the 7th day today.


Daily intraday momentum signifies a rise to the overbought zone, while the weekly momentum indicator is signifying a fall. Since the larger trend is always the stronger, risk reward ratio is in favour of selling on rises for the time being.


Since we assume (until confirmed or proven otherwise) that Nifty has entered wave 4 and wants to form a triangle, with 5 legs of 3 folds each. We may look to see whether Nifty crosses 5747 which is 61.8% of the retracement from 5815 to 5637.In fact 5747 to 5751 looks to be an ideal sell zone.  


Sunday, October 14, 2012

Nifty Astro Technicals for Oct 15 to 19 2012


Let us begin our analysis of the week October 15 to 19, with Astro indicators.
To locate any place on earth we require two kinds of coordinates- Longitude and Latitude. Similarly to better understand the probabilities of occurrence or non-occurrence of any event, we need both longitudinal as well as latitudinal Astro calculations.
Our traditional Astro analysis is mostly used based on the longitudinal position of various planets across the Astro charts.  This is why, for a fuller understanding I have been posting the declination charts. They give a latitude based understanding and bring us a little closer to interpret what the stars really are saying. Latitude positions do give a reversal time period, which may then be fine-tuned with other Astro methods.
For example, in the recent past I had posted the following declinations chart. October 04/ 05 and 11/12 were suggested as reversal dates and we all know what happened in the markets.
Let us look at an example of combining longitudinal and latitudinal studies- As per longitudinal studies; Jupiter became retrograde on October 04 as per regular chart studies (longitudinal.) As per Latitudinal studies, Jupiter reached an extreme declination level on 2nd October. So a reversal was indicated, which manifested on October 05th. More research should reveal how to exactly pin point the time of reversal, during trading hours.


Let us look at the declinations chart for this week-October 15 to 19, 2012.We also have the declination values in a tabulation here, for better understanding.
·         We see that there is a Moon-Sun declination conjunction (decl- conj) on October 15. This also happens to be a New Moon, which means Moon and Sun are in the same longitude, in Virgo, on this date. This makes this New Moon very powerful and maybe eventful.
·         Decl-Conj are just like regular longitudinal conjunctions. They produce results based on the nature of the planets involved in the conjunction. We also notice we have a Moon-Saturn decl-conj on Oct 15 and a Moon Neptune decl conjunction on October 16. Since October 11 reversal was positive for the markets (by positive I mean increase in value), we may expect these conjunctions to increase positivity.
·         Both Mercury and Pluto are unfavorable for Nifty. So the declination conjunction on Oct 19 could spell trouble. Sun-Saturn decl-conj may neutralize things a bit, but since Moon reaches its lowest point of Southern Declination we may expect a reversal from October 19th onwards. 


Please have a look at the table above .Planets in the Northern Latitude are denoted by N along-with their coordinates and planets in the Southern Latitudes are denoted by S with their coordinates. When a planet in the Northern latitude and a planet in the Southern Latitude have the same coordinates, then they behave as if they are in opposition to one another. On October 12/ 13, Sun and Venus were more or less in opposition and despite Venus being in its own star, we did see a decline on Friday, October 12, even though the positive trend remained intact. In the same time, Mars and Jupiter were also getting into opposition, from somewhat extreme positions. Positions described earlier have been highlighted.
Please see the position of Jupiter and Moon on October 19. They are also in an opposition mode. This again suggests a reversal.


-----------------------------------------------------------------------------------------------------------

Now we have a look at the traditional KP Astro longitudinal charts.

The New Moon participants, Sun and Moon in Virgo are in a trine with Natal Sun and Venus. Natal Mercury and transiting Mercury are also moving into a trine. Transiting Sun and Moon are also in a trine with Uranus. Transiting Ketu is conjunct with Natal Jupiter and Saturn.
This formation suggests an improvement in the market for the near term  
Let us see how the weekend chart looks like. The picture seems to change a little reddish.


Transiting Sun gets into square with Natal Rahu. Transiting Venus is getting all square with Natal Sun and Venus. Moon which is the trigger point is getting into an opposition with Natal Sun and Venus. Transiting Moon of course has to be square to transiting Venus, for that. This suggests a topping out possibly by the weekend or early next week.

--------------------------------------------------------------------------------------------------------------

Since October 15, happens to be a New Moon, let us look at the New Moon chart itself. Ruling planets are Saturn, Mars and Moon with secondary support from Rahu.


See this chart for October 18, 2012:


On October 18, 15.15 pm, Moon reaches 11.48.10 degrees in Scorpio. This quarter of the sky is conjointly ruled by Mars-Saturn and Moon. So this could be a significant turning date. This happens to be the 9th house, which is 12th of tenth. Sun would also have entered its debilitation house, Libra,  by then.

Now for the last chart of this blog post:
November 06, 12:59 pm:


On November 06, 12.59 pm, Moon will be in Cancer at 12:08:07.This point will be governed by Moon –Saturn-Mars-Mars. That will also be the worst debilitation point for Sun in Libra and Venus in Virgo. That could mark a low point for Nifty.
Will all this come to pass? Only the Creator knows!
But nothing wrong in examining isn`t it? Maybe over time we will develop enough techniques to help us predict the markets better.
Till then trade safely with no anticipation, and with stop losses. Let us examine the waves of Nifty in another post.
Have a wonderful week. 


Friday, October 12, 2012

Nifty Astro Technicals for Oct 12, 2012

As we expected, Nifty bounced out of the intraday contracting triangle and has begun its upward movement as b.Minor leg b has retraced more than 80% and since the next larger degree wave from 3, did not even correct 38.2% we consider that minor wave b may exhibit strength.If minor wave b crosses 5728 ( 100% line shown) then we consider wave b is going to be stronger.We should know that on October 12, 2012.
From 09.15 TO 13.44 Moon will be in Ketu star, which should favor continued bullishness.Between 10.26 am to 13.44 hrs, Moon will be in Ketu star, but Mercury sub. Now that could possibly cause some coolness.13.44 hrs, Moon will be in Leo in Venus star.Since Venus is also in its own star, we may expect the uptrend to be intact.
If we look at the updated Daily chart, we see that Nifty is to enter a positive zone from Monday. Since Monday happens to be a New Moon day and since prices are rising towards the New Moon, we may expect corrections to set in on Monday. This will likely be a two day affair.
Earlier today, Nifty had breached 5640 intraday, to go down to 5636.80.Technically with the fast fall formation seen on 08th Oct , we are more or less in wave 4.

Thursday, October 11, 2012

Nifty Astro Technicals for Oct 11, 2012

Nifty continued to drift down and close at 5652.15.It touched an intraday low of 5647.05.Open Interest decreased with Increasing volumes, and since the price decreased, it meant that weak longs have closed out their positions and new shorts did not get created. Also shorts in profit may have exited.
The above 15 min intraday chart of Nifty, shows the minor waves in a triangular formation. the final
"e " leg down is close to ending.Today was the fourth day of down move and looking at the technical internals, a bounce looks likely tomorrow.

Till 14.01 Moon is in Mercury star and the down drift is expected to continue. Post 14.01, Moon enters Leo and Ketu is the star lord.Markets may bounce back after 2 pm tomorrow.
Here is the medium term chart:

5640 is the first crucial level. Will it break tomorrow. Maybe, maybe  not.It does not matter. If the market turns up then hold on for a rise because we enter the green period next week. Possibly we will be in wave b of 4 next week.

Wednesday, October 10, 2012

Nifty Astro Technicals October 10, 2012


 Nifty is interestingly poised.Wave 1 of C of Diametric D was on for 26 days and rose by 578.20 points. Wave 2 took 40 days. Wave C took just 20 days to rise 598 points.Wave 4 should take at least 20 days and end by November 2 to 5.Different wave sections are shown in boxes.    In our previous post we had mentioned that the terminal impulse in minor wave 5 of 3 should end by 5640, and that could be the first leg of wave 4 of one larger degree. So we wait to see whether 5640 is breached. That will mean wave 4 is truly on.
So what next? Let  us use Financial Astrology. Based on planetary aspects and lunar behavior  we have shown three bands. Yellow is neutral with a negative bias, green is positive and of course red is negative.Planetary positions and impacts have been covered in detail last Sunday.
First level to watch is 5640 and then 5585 to 5587.Any upside seen on Wednesday morning or Thursday may be sold into.Expect a b wave recovery from next Monday onwards till Oct 19.From Oct 22, the fall should continue as c wave of wave 4. We will then know whether it is to form a triangle with 2 more legs d and e . This bouncing on and off ought to continue till November 3/6 or earlier till Oct 30.
We continue holding shorts with a stop loss of 5751.
Of course all depends on Miss Nifty and what she decides to do. We all know her as a rather whimsical lady!
Needless to say, markets are turning treacherous and so stop losses are a must. No anticipation gives you profits with peace of mind.

Tuesday, October 9, 2012

Nifty Astro Technicals Momentum play

Stochastic movements in different time frames could give us clues to the immediate market moves.
See chart above. There is a negative divergence and the daily 9 period slow stochastics is getting ready to move down.
Look at the chart below:

The 5 min stochastic is pretty over bought. Now when it starts reacting downwards from the high that is when a short trade could be thought of.Confirmation will come when the previous bar low is taken out.

Sunday, October 7, 2012

Nifty Astro Technicals- Gann Price and Time Squaring Oct 06, 2012

Nifty had broken down from an important 1X1 Gann Angle on October 05 and had also had a maturing time and price squaring happen on the same day. The Gann time lines were repeating on the 14th calendar day,since the previous significant low.

Nifty Astro Technicals -A re-look at the New Moon charts of September 16, 2012

Dear all,

Have a look at the New Moon chart of September 16.This blog post was created on September 20, 2012. It makes interesting reading now that we are closer to the next New Moon, which is on October 15, 2012.


http://niftyastrotechnicals.blogspot.in/2012/09/september-16-2012-new-moon-chart-of.html

Nifty Astro Technicals October 08 to 12, 2012


The freak trade on Friday has wreaked havoc on the internals of the market structure and cooled the bull fervor to some extent. Since everything which happens in the market is part of market reality we accept the situation and move on to our analysis.
Last week we had seen Wave 3 gathering strength and wanting to push ahead. We had expected the third wave push to continue till October 10th.However now, after Friday`s price action it looks like Wave 3 has terminated and wave 4 has opened downwards. In fact even minor wave a of 4th looks completed. Currently minor wave b of 4 seems to be on. Further analysis is possible once we see how strong or weak this wave b is. Since wave 4 is now overlapping wave 2 territory in the Minor leg up, we need to be careful about the possibility of a terminal impulse manifesting.  If we consider wave 1 as elongated, then wave 5 should confine itself to 5800 or even less. The ensuing correction could pull down Nifty to 5640 levels, the beginning of minor wave 1, in wave 4 of one larger degree. In this case, once wave 5 is formed, then the correction to 5640 levels should happen in 50% of the time taken from wave 0 to 5.

 Let us see the larger picture. See daily chart below:
The thick blue lines indicate that wave C of diametric D, which began on June 04th, is close to achieving equality   with Wave A of diametric D which began on Dec 20th, 2011.This may happen if Nifty reaches 5872.Time wise, wave A had taken 45 trading days and wave C would have consumed 89/90 days by the time band Oct 10 to 12.
The green square high lights the movements of Irregular Flat with C wave failure of wave 2 of C. The Neo Wave projection of 161.8% of wave 3 of C, because of this Flat formation is 5890. So the price band 5872-5890 appears crucial. This is just 126 points away from Friday`s closing.
But the freak incident on Monday has confused the picture and we see the emergence of a terminal impulse in the minor formation. According to this Nifty may not move much above 5800.See the 15 min chart. Again this was caused by an abnormal market movement and the market is likely to reject this outcome. We will know this only on Monday, October 08, 2012.
If this is so, then we look for an up move towards 5872 area. If not, we should know at the 5774 area itself. In that case, we look to go short around 5774 region for a play up-to 5640 initially. This could tentatively go up to 5530 levels. This may possibly conclude wave 4 of C after which we still expect one more up move towards 5975 levels which could be wave 5 of corrective wave C of diametric D. Why 5975? Because 5975 represents 80% of the retracement from November 08th  2010 top of   6335 to December 20, 2011 low of 4531..


What do the stars say?
As indicated on the declinations chart last week itself, Moon has been showing reversal signs from October 5 itself. Moon reaches its minimum Latitude on October 11th and MOON`S declination crosses Celestial Equator on December 12th.Both of these signatures are reversal signs.

The Sun-Pluto waning square of September 29, will begin to have its reversal effect between Oct 09 to 12.The Venus Neptune opposition of Oct 04,will manifest negatively before Oct 16.Jupiter had turned retrograde on Oct 04th.We expect a powerful reversal from a crest, on Oct 11th.Mars Neptune waning square of Oct 08,may affect markets negatively between Oct 12 to 17th.Sun forms a waxing trine with Jupiter on Oct 09th.Powerful reversal effect from crests is expected between Oct 12 to 19.Venus and Pluto form a waxing trine on Oct 09, 2012.
As we can see, most of the aspects which have formed in the immediate past or which are about to form in the near future seem to indicate reversal from crests. The common central time band seems to be Oct 10 to 12.
Daily planetary positions have been indicated in the tabulation below, with universal color coding symbolizing the effects expected.


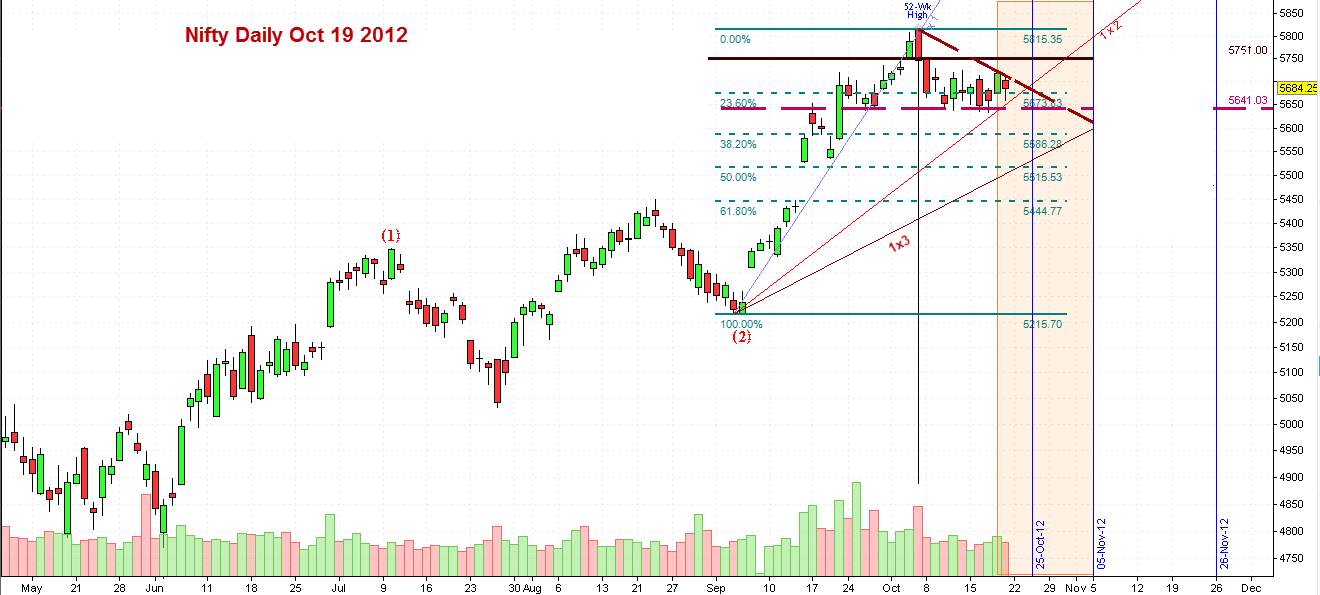
Please see the planetary effects of corrections in the overall context of bullishness, as depicted by the wave patterns.Please note that all that has been discussed above are only conjectures. Price movements alone are supreme and will dictate the future progress of Nifty. It is not prudent to open positions, in anticipation. Neither is it safe to operate without stop losses. Let the price tell us what it intends to do. The studies merely help us to be prepared.Have a wonderful week of trading, without any freak incidents!