
Wednesday, August 29, 2012
Nifty Wave update
Nifty Weekly Cycles
Nifty Weekly cycles are interestingly poised. There has been a reduction in the upward thrust we saw in December 20, 2011 and the one we saw from June 04, 2012.Also as Rajendraji points out, we are due for another long term cycle, the 55 month cycle. The time band is August 31 to September 15, according to him.If so the present weekly cycle will be shortened such as what we saw prior to December 20, 2011.
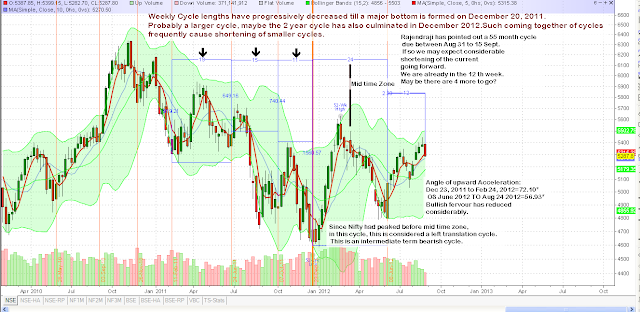 Our Wave theory is suggesting one more upside post the current 4th wave.If these two synchronize,then a major cycle top is due within the next two weeks. Astrologically, we are in the time band between two square formation of Uranus and Pluto.

Monday, August 27, 2012
Nifty Lunar effects August 27 to 31, 2012

August 27: Moon is in Venus: Market may begin normally, even improve and then dip lower intraday. Recovery by close.
August 28: Moon is in Sun. Recovery of late evening may continue today
August 29;: Moon is in Moon star. Negative day.
August 30. Moon is in Mars star. Negativity should continue
August 31: Negativity may continue Reversal upwards expected.
Intraday probability techniques are very much under development. So please see the price movement and enter trades with the highest risk reward ratio in your favour.
Sunday, August 26, 2012
Nifty Wave Scenario Aug 27 to 31, 2012
With the neutral triangle in wave 2 and with wave 3 beginning right on cue, we seem to be progressing satisfactorily towards wave 4 and 5 of this wave C of the diametric leg D.
This then is our preferred counts for the week, unless the market communicates otherwise....

An analysis using Fibonacci time zones, retracements and Gann lines...

Here is the retracement on the hourly...

Whether it is wave counts or astro projections, unless the price moves in the anticipated direction and confirms all positions are dangerous. However sure we are do not ever trade without a stop loss.
Have a wonderful week of trading. Do post your comments-that sure as heavens, enthuses me and keeps me going!
Planetary aspect clusters and effect on Nifty
When there are more than one pair of planetary aspects coming closer together in a time band, we may expect to see market reactions happening. Always the clusters would signify a change in direction in the market.Inside the time band, the event will manifest only if lunar phenomena takes place. It could be anything, a New Moon, Full Moon, a powerful declination change, or a conjunction of Moon with the major set of planets which form part of the aspect cluster.
 We can see in the chart above, how every major top and bottom are defined by planetary aspect clusters and how the effect manifests when Moon gets involved.A powerful single aspect such as Sun square Jupiter of Jan 24 had only a cursory effect.
Examining the phenomena, closer to our present time of trading we continue to see correlations:

Accordingly the Full Moon of August 31 assumes reversal significance. Up or down will always depend on how the market was, going into the lunation.Interestingly, on September 04, Moon opposes Saturn & Mars, squares Venus,trines Sun, Mercury and Pluto all in 24 hours!
In plain words we expect the present small decline to persist this week. We expect a reversal on August 31. We expect a sideways market with ups and downs till September 4. Then we expect an upward reversal post September 04.Does the projection remind you of a 4th wave or a 2nd wave or a B wave? If so then probably you are correct, because Neo Wave suggests that we are in the 4th wave of Wave 3 of Wave C.More of it in the next post.
All this is probability projections and we will make our trading moves only when Nifty confirms her intentions with price moves.
Saturday, August 25, 2012
Nifty pivots for the week beginning August 27 2012

Wednesday, August 22, 2012

Monday, August 20, 2012

Astro picture of Nifty August 21 to 24, 2012

Often, Moon channelizes the pent up energies in planetary
aspects and releases them, to form events. On August 21, Moon is square Venus
and opposite Uranus. So the earlier Venusian square- opposition energy
involving Uranus and Pluto of August 16th may find expression by way of a
decline, on August 21, 2012.
Mars and Saturn were conjunct on August 15.After that we had
trading for two days. This orb is in effect till 8 days, which is till August
28th. However, Moon is conjunct Saturn at 05.30 am on August 22, 2012. It will
be conjunct Mars at 11.54 am on the same day. So we may see a restricted
decline. Why restricted? Because they happen to be opposite energies.In fact we may expect recovery after 12.43 pm,when Sun sextiles Moon and Mars.
If nothing happens that means the succeeding aspect is
overpowering the current energy play. For example, only hours later, at 04.27
pm, Moon will trine Neptune. Neptune and Sun are within 2 degrees of an
opposition, due on August 24. However my take is that since it is a Rahu day and
Rahu is square Sun, we may still have an initial decline followed by a recovery.
On August 24, at 17.08 pm, Moon conjuncts Rahu, this is
squaring Sun which is in opposition to Neptune. This could mark a reversal of
the declining trend.See the notations on the graph above for more information.
Some of the major aspects in the coming weeks:
Venus was square Uranus on August 16 th. Nine trading days
orb is between Aug 16 and 29th.Chances of having a crest and then a trough are
high, in this time band.
Venus was opposite Pluto on August 15th. Again the trading
orb is 7 to 10 days. So a crest is expected on both counts closer to August
28th.
Sun opposes Neptune on August 24. With an orb of 8 trading
days we may expect a big reversal from a crest. (2:1 chances of a trough).This
is a powerful signature and the date of signification is September 04, 2012.
On August 29, 2012, Sun forms a waning trine with Pluto.
Another signature with 9 trading day orb! September 10th is the date. This
pertains to formation or culmination of intermediate tern cycles.
On September 02, Venus forms a waning trine with Saturn.
Within an orb of 5 trading days we may expect a trough to form. That is
September 10th.
On 7th September Sun forms a waxing square with Jupiter.
This is another granddaddy of an aspect. With an orb of six days, we may expect
a powerful reversal, on either side. That is if prices are falling into
September 17th, then buy. If they are climbing into a crest, then sell.
And on September 19th, 09.15 am, Uranus and Pluto form their
second square of the year. A day later Sun trines Ketu and sextiles Rahu.
On September 27, Venus squares Mars. On September 30, Mars
enters Scorpio, where it can do as it pleases. On October 2nd, Mars conjuncts
Rahu. We will discuss these distant aspects in the coming weeks.
We do have an array of planetary aspects coming up. One
thing is certain. Energy levels in the markets will pick up and there will be
several opportunities to make money, provided we sincerely follow the price
movements and take positions where the risk rewards are in our favor. Astro
principles are only guidelines. Once the price moves in the direction of our
anticipation, these principles will help us take trades with increased
confidence.
Nifty Astro Technicals -A technical look-August 21, 2012 onwards..
After reaching 5399.95, Nifty, on August 17th, reacted all the way to 5341.70, before closing flat at 5366.30.It just about managed to close higher than 5362, which the closing on August 16, 2012.
Rather than fundamentals, it was just the liquidity pushed in by FII momentum traders which kept Nifty floating. Fundamentals, in fact seem to have worsened, what with Coalgate and all the sordid stories related to it.It is sad to see even respectable corporates figuring in the scam.Morally we seem to have touched the nadir.As a student of Financial Astrology, I can only marvel at the way big money seems to be caught out in this developing Uranus Pluto square. It is not in India but everywhere.And to think we have gone through only just only one square...there are six more left!
Let us look at some Fibonacci retracements..

 Personally, I think the reaction may stay within 5241.
Even the one minute time frame shows a 50% bounce and a triangular formation which this pitch fork chart has captured nicely.

Here are our preferred wave counts for Nifty:

Rather than fundamentals, it was just the liquidity pushed in by FII momentum traders which kept Nifty floating. Fundamentals, in fact seem to have worsened, what with Coalgate and all the sordid stories related to it.It is sad to see even respectable corporates figuring in the scam.Morally we seem to have touched the nadir.As a student of Financial Astrology, I can only marvel at the way big money seems to be caught out in this developing Uranus Pluto square. It is not in India but everywhere.And to think we have gone through only just only one square...there are six more left!
Let us look at some Fibonacci retracements..


Even the one minute time frame shows a 50% bounce and a triangular formation which this pitch fork chart has captured nicely.

Here are our preferred wave counts for Nifty:

Thursday, August 16, 2012
Nifty Astro Technicals- Intra week Outlook August 16, 2012
After several weeks of to-ing and fro-ing, our Nifty at last managed to
cross over 5378 and close at 5380. 5378 was the island reversal top made
on April 03, 2012. Technically this is a bullish sign. This means that
Nifty is all set to march towards its next target, of 5499, the market
top of March 14, 2012.

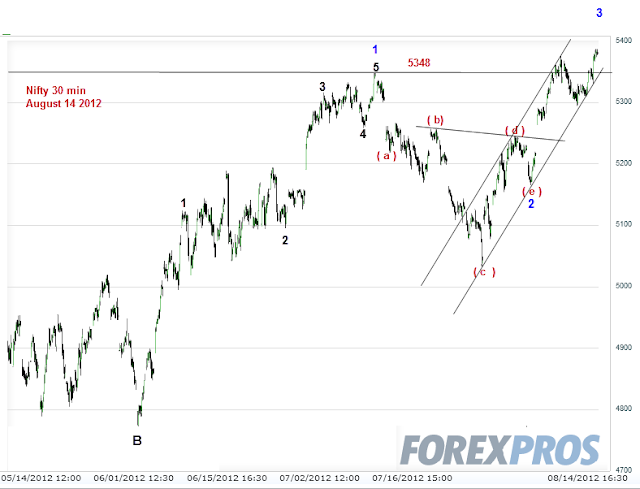
Wave wise, with the conclusive close above 5348, we are in the 3rd wave a leg and this should move higher immediately.
a of 3 which begsan from 4164 has already movrd up 223 points and so a reaction is imminent.
When could it possibly happen?
Since the market only slowed down during the declination turn. the next lunar event of New Moon on August 17 could trigger a reversal.Also August 17 is ruled by Mercury, a negative planet for Nifty.All aspects will have their energies translated into market action, the coming week, it looks like.
In other words, Nifty may improve tomorrow ( April 16) and react down on April 17th.Negative build ups of the aspects may start unfolding next week.
As usual let us wait for price confirmation after the astrological event.

Wave wise, with the conclusive close above 5348, we are in the 3rd wave a leg and this should move higher immediately.
a of 3 which begsan from 4164 has already movrd up 223 points and so a reaction is imminent.
When could it possibly happen?
Since the market only slowed down during the declination turn. the next lunar event of New Moon on August 17 could trigger a reversal.Also August 17 is ruled by Mercury, a negative planet for Nifty.All aspects will have their energies translated into market action, the coming week, it looks like.

In other words, Nifty may improve tomorrow ( April 16) and react down on April 17th.Negative build ups of the aspects may start unfolding next week.
As usual let us wait for price confirmation after the astrological event.
Monday, August 13, 2012
A Heliocentric view of Nifty
In Financial astrology, we normally take earth as the centre and see the planetary positions in relation to the earth. There is another school of astrology which considers Sun to be the centre. This is called Helio centric Astrology.Here Sun will be fixed, at 0 degree of Aries. Rahu and Ketu are not considered in this system.The advanced methodology takes into consideration, several trans uranian asteroids and treats them as additional planets.
For the time being let us stick to the basics and see how Heliocentric astrology applies to Nifty.
Here is the first trade chart of Nifty futures:
 Planets in the tenth house are considered important.Whenever there are aspects to them or
whenever these planetary aspects or their variations occur, we may expect reactions in the market.
Let us see two examples:
One high and one low:
 Here is the Heliocentric astro chart for January 08, 2008:
 See how intimately Jupiter and Saturn are involved with the other planets? Mercury moves faster than Moon when seen from the Sun and may act as a trigger., along with the Moon.
 Here again apart from the observations given, Mercury forming a trine with Moon and Saturn, when Mercury travels from 2 deg Capricorn to 18 degrees is another powerful trigger factor leading to a low.
Moving on to the present, these are the observations:

 Since we do not find a Jupiter -Saturn engagement there is no expectation of a significant high or low.The other planetary combinations seem to indicate the trend of the week.
We may watch and see how it unfolds this week.A market which holds out against negative aspect is considered strong. Most often there will be some underlying reason, which was not unearthed.
Please give your views on this astro methodology.You are welcome to correct my errors.My take is anything which can improve our trading is welcome. And like the old adage, if all rivers lead to the sea, then all proper astro methodologies should lead to the same conclusion.
For the time being let us stick to the basics and see how Heliocentric astrology applies to Nifty.
Here is the first trade chart of Nifty futures:

whenever these planetary aspects or their variations occur, we may expect reactions in the market.
Let us see two examples:
One high and one low:


Moving on to the present, these are the observations:


We may watch and see how it unfolds this week.A market which holds out against negative aspect is considered strong. Most often there will be some underlying reason, which was not unearthed.
Please give your views on this astro methodology.You are welcome to correct my errors.My take is anything which can improve our trading is welcome. And like the old adage, if all rivers lead to the sea, then all proper astro methodologies should lead to the same conclusion.
Nifty Astrotechnical Charts August 13-17, 2012
In the 30 min chart, point x has been clearly marked. Now we anticipate, a downwards, b upwards or sideways, and c downwards.That could complete the correction of 2 and only then c will start.We may look to the trend-line break of c-e to go short. If that happens then we watch whether the market fills the gap above d.

As we see from the daily charts, 5245 seems to be important for this week.Nifty futures has also turned down from top of BB.


As we see from the daily charts, 5245 seems to be important for this week.Nifty futures has also turned down from top of BB.


Sunday, August 12, 2012
Nifty Astro Technicals August 13 to 17, 2012

Let us look at the Lunar effects this week:

Mercury when turning direct, tends to bring in communication which contradicts that which has been said during the retrograde period. How much the news would be afflictive or effective depends on the aspects which follow, Mercury becoming direct. Since the first set of aspects all look negative, such as Mars Saturn conjunction, Venus opposite Pluto and square Uranus, we couuld expect a turn down in prices in till Thursday and a recovery ( or a bottom ) by Friday.
What could be the possible price levels- may be determined by our wave patterns.
As usual we will wait for price confirmation before committing our money on the line based on Financial Astrology.
Have a great week of trading!
Friday, August 10, 2012
Nifty Astro Technicals week ending August 10, 2012

Weekly trend has been strong..Will it assert itself today?
During the week beginning, we had expected green most of the week and green it was.We had expected profit taking towards the close of the week and it emerged in the past two days.
So where can we anticipate the week to end?
Here is how the waves look like... 

Astrologically it is a SUN Day today. Sun is in Mercury.Sun is good for Nifty and Mercury is bad for Nifty. Since Sun is in the ascendant, we may expect Nifty to move positively.By 14.52 hrs, transiting Moon becomes conjunct with Natal Saturn. That could trigger selling again.
It is a quarter moon to boot. Looking at the sky for next week, it looks prudent not to carry over any long positions over the weekend.
Have a great trading day!
Wednesday, August 8, 2012
August 08, could be interesting...
Elongated Zig Zag correction has fallen 5348.55 to 5032.40,
about 316.15 points.(c )at 5032.40 ends the abc correction and till date, the retracement has been
317.70(5350.10-5032.40) points. So the retracement has been 100%.
The last leg down, (c) has
moved down by 224 points. Since (b), (c ) and (d )have
formed a Neutral Triangle, the expected up move from the point ( e )had been 224x75%= 168 points. That gives us a
target of 5164+168=5332 points.
But Nifty couldn`t care less for these calculations! She
zipped past yesterday, to touch 5350.10 and then do a little retreat.
In that case, we now have the possibility of wave 2 having
ended at (e ) and 1 of wave 3 begun.
It all depends on today`s movement.
If Nifty continues to appreciate, then we are in 3 of C.
If Nifty turns down then we mark 5164 to 5350.10 as x wave and look at another abc
correction unfolding. In other words wave 2 would continue beyond (e).
We continue to be in Mercury`s retrograde period today, till
11:09:58 hrs today. So the possibility of Nifty moving up to 5376 and then
retreating into an x abc formation also exists. This
is because during retrogrades of Mercury, markets do not respect projects or
supports or resistances.
On the other hand today happens to be a Ketu star day. Ketu
is in Sun, which is bullish for Nifty. So the up move could continue after a
minor correction…..

Tuesday, August 7, 2012
Indian Indices and Jupiter in Taurus
Jupiter comes to the same celestial position in Taurus, once every 12 years.Last two occasions were in June 88-89, June 2000-01.And now in May 2012- 2013.
Jupiter entered Taurus on May 17, 2012.
Nifty 11th house: 20:14:16 in Taurus
Interestingly, India`s Ascendant is 20:0:47 in Taurus.
28th August Jupiter moves into Nifty`s 11th
house.
On 4th October, Jupiter turns retro at 22:25:57
On 10th Nov, Jupiter moves back into the tenth.
On 30 Jan 2013, Jupiter turns direct.
On 14th April, 2013, Jupiter moves into 11th
again.
And leaves Taurus on May 2013.
In 1988-89,Jupiter formed a significant low, after entering Taurus.
Immediately after entering 20" Taurus,Jupiter caused a low.And leaves Taurus on a high note. In fact soon in Leo it forms a major top.Jupiter had formed a waxing trine with Saturn in March 1988, which was a major low.


Fast forward to 2012. Jupiter is emerging out of a waning trine with Saturn. So the patterns could be similar to 1988-89. Also every time Uranus- Pluto square was at hand, and Jupiter was in Taurus, the US Markets blew through Taurus and formed a major crest when Jupiter was in Gemini,fell through Cancer and formed a major bottom in Leo. Leo.Since the markets are more synchronized now, Indian markets may also improve when Jupiter is in Taurus and top out when Jupiter moves to Leo.

Monday, August 6, 2012
Nifty AstroTechnicals August 06 to 10, 2012
Last week belonged to Mercury.The markets moved on utterings from the Central Bankers. But let us remember that all such honey and milk offerings are being made when Mercury is retrograde. This means when Mercury is direct, the very same statements will be dramatically corrected.Reviewing that which has been communicated, is a key trait of Mercury retrograde.
Mercury will be direct on August 08th and will enter the first house of Nifty Futures on August 24. That should be an interesting period of time! Meanwhile the markets are tantalizingly poised...

Nifty did not pierce the 5256-5268 time band, thereby implying considerable underlying weakness in the impulse structure which took shape as C from 4770.While 1 of C topped out at 5348, 2 of C which initially looked like it will be a clean corrective abc wave formation, seems to have lost its form in the current b segment. It looks like it will turn into a triangle and then according to NeoWave, this may become a terminal impulse. That means later part of the month, we may see Nifty piercing 5000 levels as well?
Let us look at the daily charts...

Iam still hoping that the structure recovers, Nifty moves to b by around 10/13 August and then turns down into a c which bottoms out on August 17..For that 5000 levels should hold If not then the turn from b will take us to 4700 levels.
The monthly chart also does not inspire much confidence...But the FIIs seem to be investing. Probably the other regional indices are worse off!
And now to the astro charts..


With so much of green around, Nifty may move higher till August 08. By August 09 and 10, there could be some profit taking and not a sell off.Probably we may touch or slightly penetrate the 5256- 5268 levels and turn down next week.
Whatever it is, please wait for the real time indicators to show their hand before taking any positions.
Have a wonderful and safe trading week!
Sunday, August 5, 2012
Jupiter, Saturn and the Kondratieff cycle of India
Nikolai Kondratieff, a Russian Economist, after years of
study, in 1931, released his findings in Russia which stated that capitalistic
economies across the world were about to enter an age of prosperity and growth.
Communist Russia, promptly jailed him, sent him to Siberia, where he eventually
died.
What in essence did Kondratieff postulate?
·
Economic cycles repeated themselves with an
approximate time periodicity of 54 years. 54 years between the peaks and 54
years between the troughs of the cycle. In essence the cycles could oscillate
between 45-63 years (54 plus one sixth or nine years).
·
The cycle is made up of 4 stages or phases-
Spring, Summer, Autumn and Winter. Spring and Summer represented growth phases
and Autumn and Winter represented contraction phases. Phases of the cycle were
not even. During periods of growth, prosperity years were more than contraction
years and vice versa.
·
During Contraction years, Agricultural output
suffers the most, as compared to other economic activity. Drought and famine
are common.
·
Many new inventions and technologies are
invented or discovered during the contraction phase.
·
These new technology or products will only be
applied in a mass scale once the contraction phase ends and a new cycle begins.
·
At the beginning of the growth phase, gold
production increases. Markets for goods and services will expand. Credit
expansion begins in a small way and later gathers momentum.
·
Closer to the end of growth phase of the cycle,
emotive wars break out. Closer to the end of the contraction phase, economic
wars break out.
Two critical observations need to be recorded.
1.
This cycle must not be confused with Stock Market
Cycles. Stock market cycles are a reflection of the perception regarding the
future of the Economy and hence will always lead the Economic cycles, sometimes
by as much as one year. Typically between 6 to 12 months.
2.
Economic cycles are no more Agriculture oriented.
First Industrialization and then Technology advances have changed the nature of
the ingredients which affect the Economic cycle. The extent and the timing of
these two changes vary from Nation to Nation.
Based on these postulates, we shall attempt to see the
Kondratieff cycles which affect us, in India, shall we? Let us also look at
some long term planetary cycles and their correlation to Kondratieff cycles.
We begin with the 1971 Indo-Pak war. It began on December 03,
1971 at about 17.40 hrs and ended on December 16, 1971, at 16.31 hrs. In the
same year on October 17, 1971, Saturn from Gemini opposed Jupiter in Sagittarius.
Thereafter Jupiter was moving towards forming a conjunction with Saturn. This
conjunction eventually took place on January 01, 1981, in Libra.
So from 1971 to 1981, Jupiter was moving through what is
called as a waning or declining phase. Saturn is the slower planet and Jupiter
faster. When Jupiter pulls away from Saturn after a conjunction, we say,
Jupiter is in a waxing formation with Saturn. When Jupiter moves towards Saturn, from behind, we say, Jupiter is in a waning formation to Saturn.

Now 1971 war was a war of economic considerations.
Why so? According to Wikipedia,
“Approximately 10 million people fled East Pakistan and took
refuge in the neighbouring Indian states. The East Pakistan-India border was
opened to allow refugees safe shelter in India. The governments of West Bengal,
Bihar, Assam, Meghalaya and Tripura established refugee camps along the border.
The resulting flood of impoverished East Pakistani refugees placed an
intolerable strain on India's already overburdened economy.” The war was a
successful bid by India to stem the flow of refugees and prevent economic
bleeding.
This brings us back to the topic under discussion-so 1971 to
1981 represents the last years of contraction of a previous Kondratieff cycle
which had its origins sometime in the 1920s. Maybe in sync with the Great
Depression years in the US. Who knows? We have precious little records from
those times.
1971 to 1980 represented slow growth under the burden of a flourishing license raj and it was the external environment changes and India`s response to them, which might have brought about the closure of the contraction phase of the previous Kondratieff cycle.
The external environment changed dramatically in the course of 1979 with the second oil price shock, the full impact of which was evident in 1980-1981, the current account went into deficit and net foreign capital inflows increased to 1.7 per cent of GDP.
If we assume the Economic cycle bottomed out in the later half of 1980, then this ties up with the Bombay Sensex touching its all time low in December 1979.
Jupiter was conjunct Saturn on January 01, 1981 in Libra.One cycle of Jupiter and Saturn, from conjunction to conjunction is 19.85 years and it takes approximately 59.55 years for Jupiter and Saturn to come back into conjunction in the same sign. This seems to tie up with the length of the Kondratieff cycle- varying between 45-63 years.So the next Jupiter -Saturn conjunction, in the same sign, of Libra, after January 01, 1981,is on 31 October, 2040.

Waning trine in 2014, may be a big top , followed by a side ways market in 2015 and then an explosive upmove close to 2016.
Here is the weekly chart:

Conjunctions of Jupiter and Saturn are called as Royal Conjunctions.For several centuries now, people have been interpreting them to know the prevailing economic cycles of various kinds.
Of course the Economy is subject to various other cycles, some of them very long term.What is amazing is that periodically these cycles seem to come together in times of great import.The trick of course is to decipher them clearly.
Iam not anticipating any particular price targets here. That is best done with application of Elliott wave Principles closer to the events.
These are postulations. I request visitors to this blog to please value add with your comments. Let me be corrected wherever Iam wrong in my assumptions or projections.
Of course, these topics are for academic interest. Please use such information for trading or investing only after you consult your Financial Advisors.
Of course, these topics are for academic interest. Please use such information for trading or investing only after you consult your Financial Advisors.
Saturday, August 4, 2012
December 21, 2012- The Mayan Moment

If we look closely at India`s Independance chart for December 21, 2012, we may observe,
- Pluto, the planet of debts, big money, powerful corporations, and secret dealings is in Sagittarius at 14":59'.Pluto is also in Venus star, the planet which rules money and currencies.Pluto is in India`s eighth house, the house of difficulties.
- Jupiter, the planet which rules banks, money expansion,credit growth etc., is in Taurus, ruled by Venus.Taurus is also the Ascendant of India.Cautious, slow to change yet aggressive when provoked bull.Jupiter, in Moon star, at 14":58'. Moon of course reflects public opinion.
Unfortunately, in Taurus, Jupiter is in the 12th house. The twelfth house rules financial losses, expenditure, mishaps, mass hospitalizations, pressure due to foreign debt, etc.
- Saturn, the Great Disciplinarian, is powerfully exalted in Libra, at 14":46'Libra is the sixth house which rules financial solvency of the nation, political stability, relations with neighbors, communal harmony, litigation, judicial functioning, labor relation, general health of the public and in general public peace.Saturn is in Rahu Star and Ketu sub. This means this transit may provoke great fear and discomfort in people.
- If we follow the arrows, we may notice, Pluto is in a negative quincunx (150") aspect with Jupiter.Jupiter is in a negative quincunx (150") aspect with Saturn.And Saturn is in a free flowing sextile with Pluto.Such a formation is called a YOD or "Finger of God" formation.In such a combination, the negative energies flow freely between the base planets of the triangle and powerfully hit the planet at the apex of the triangle.
- If we fast forward to December 23, 2012, we can see the deadly energy flowing strongly in the direction of Venus, which is in opposition to Jupiter.Venus is in Saturn star in Scorpio, which is always known to carry a sting in its tail.
- This time band is right in the orb period of the Solar Eclipse and Venus Eclipse which had manifested in May 2012.
Negativism among the disgruntled public against debt creators and debt dealers will increase heavily.With Jupiter under such severe affliction, markets may tank. Rupee depreciation and Balance of Payment issues may dominate headlines.
Radical and innovative solutions to deal with debts,may be brought by Governments across the world.
Friday, August 3, 2012
Nifty Astro Technicals Intra week review
Nifty moved more or less in line with our expectations this week, from July 30 till August 02,which is yesterday.As anticipated the Full Moon coupled with a Moon star day had applied the brakes on a good up move which began on Monday, this week beginning, on July 30.
Saturn and Mars have their declinations crossing each other`s today, August 03.Today also happens to be a Mars day. So the negativity could be expected to continue.We are already witnessing the effects of the impending Saturn Mars conjunction-Train accidents involving fire, widespread power black out,riots,low intensity bomb explosions and restive mobs everywhere.
See the chart below:
Since Mercury is retrograde, Nifty could not quite reach the price targets expected of her.Instead of reaching 5258 zone, she turned down from 5246.
Red transparency indicates this week`s movement.
Subscribe to:
Posts (Atom)