Pages

Sunday, December 30, 2012

Nifty Astro Technicals Dec 31 2012 to Jan 04 2013

A rather eventful and good year from Indian stock markets point of view is coming to an end. During the last quarter we kept on feeling that the current ongoing rally is about to end, but the market kept on moving up and now the year is drawing to a close.From an Astro point of view, it looks like the bull move is likely to continue for some more time....

The next dates to watch out for are January 11 to 14 2013.The decline we had expected last week had materialized but not to the extent we had expected. Dec 31 to Jan 02, ought to see an upward reversal..


The technical picture also is mirroring similar views---that of an up move now..


Here are the wave counts....


We wish you a very wonderful and prosperous 2013!

Tuesday, December 25, 2012

Nifty Astro Technicals-An explanation

This post is to address a fundamental concern.Our friend, Somnath Mukherji had asked a very important and interesting question:
".....Where I get confused is, most of the time, there is too much of information. Moon declination, trines, conjunctions, so many planets and so on. Something or the other is always going on somewhere. Now we have to find out, which of these really have some effect on our markets...."
Iam quite sure this must be a question several readers who are new to Astrology or have only a passing acquaintance with Astrology must have asked themselves.
Let me make one assumption before attempting to answer this important question. I assume that most readers of this blog are people who are active traders or investors and that the reason they read this blog is to get an edge on market moves through Astrology.This must be one among many such blogs most of them visit routinely.
Now let us attempt to answer.
There are two axioms which work quite effectively in Financial Astrology.
1.The Moon must be involved in all manifestations or actions which we see in the physical plane.
2.It is not only the Moon`s longitudinal positions but also the latitudinal positions  which really point out what happens in the markets.
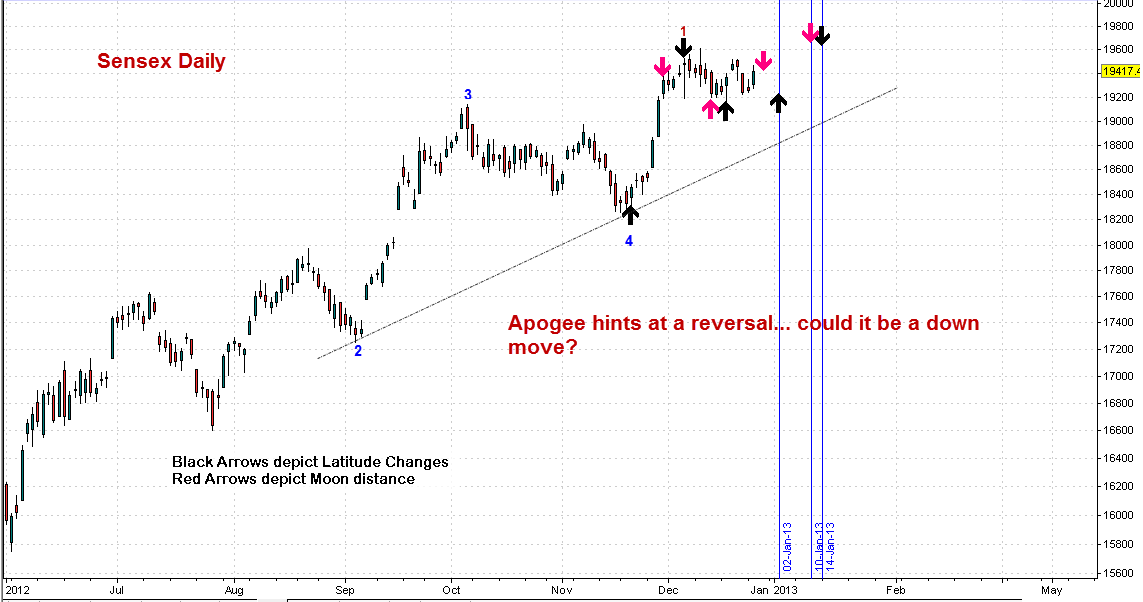
Let me illustrate with two charts:


Black arrows are points where the Moon reaches maximum or minimum Latitudes.Red arrows are the times when Moon reaches its maximum distance from the Moon or minimum distance from the Earth.
I always select two adjacent dates whenever Latitudes are involved.
Iam sure anyone with rudimentary understanding can make money with just these two leading indicators. I have not even used New Moon or Full Moon or  Declinations here.All the aspects and star based analysis are just to know the depth and extent of the movements as understood through the Moon.
If we can combine this with Fibonacci and Elliott wave understanding Iam sure we can have a simple method of trading the markets.Then one doesn`t even need to know the play of aspects of larger planets actually!
Now, this is not a fool proof method. There will be false signals occasionally.This is why I keep cautioning about stop losses and allowing the markets to  show the way first.
The larger aspects and formations will reduce the errors considerably. But one can take his time about learning those, if this method is first deployed.
I keep posting all the important aspect formations every week, along with the declinations and other Lunar formation.If on a date if there is no lunar formation but Moon is involved as a third party in an aspect between two planets then one must be careful about reversals on that day.
I do hope this post removes some of the confusion prevailing in the reader`s minds.  

Nifty Astro Technicals-An Astro outlook Dec 26 to 31


Jupiter and Pluto had been in unfavourable QC on Dec 21.
Saturn and Jupiter have been in unfavourable QC from December 22nd.
On December 23, 2012, Sunday, Venus opposes Jupiter.
December 26th is a Moon star day.
Sun begins to square Uranus today.
This negativity is countered by Saturn being closely sextile to Pluto.
On Dec 27th, which is a Mars star day, they will be exactly sextile.
From Dec 28th Saturn and Pluto will start separating.
Mercury moves into volatile Sagittarius on Dec 28.
On the same day at 15:51:54 hrs, we have the Full Moon.
Sun is also approaching QC with Jupiter.
On December 31, 2012, Sun conjuncts with Pluto.
Since Lunation such as Moon Apogee and Minimum declinations are also falling in the period December 26 to 28, we may expect the market to decline from Dec 26, with a minor recovery on 28th and to reverse well, on December 31 or January 2nd..
December 31st happens to be a day of minimum lunar latitude and extreme Pluto declination.
The feeling one gets is that this cliff business will go down till the last ball before a decision is made.
Astrologically there is some more juice left in the medium term, for the markets.
Of course taking positions must be safely done with appropriate stop-losses and after market prices move in expected directions. 


Monday, December 24, 2012

Nifty Astro Technicals-A very short term look

Looking at the faster retracement from 5824 on December 18, it was assumed that wave 3 of 5 had started. But subsequent movements have proven that wave 2 corrections are still continuing.In the complex correction   which is currently on, one more down-leg looks imminent. The important question is will it break the channel of correction?


 In the meantime….
Yesterday`s peaceful protest turning into a violent  affair was sad and disturbing. We did discuss YOD and how change is imminent. Uranus and Pluto will ensure that....
But it is also the season of Forgiveness and Celebration.....So here is a reflection

"Every act of violence has the seed of peace
When the world was similarly in unease
A divine soul incarnated here as Jesus
To spread Love and Peace among us
Once again in these times of strife
We remember His words of life
And celebrate Serenity and Love
As Christmas, gaiety and laughter, hand in glove
Let Him touch you all
And let peace and prosperity begin this fall.
Happy Christmas!"
Detailed Astro Analysis shall be taken up on December 25.
Happy and safe trading!

Nifty A long term look..


Since 2012 is drawing to a close, let us take a peek at what is in store wave wise in 2013.Technically it appears we are in an inflexion point. The current bull trend could continue or it could top out any moment, any day.So how does the long term picture look like?


Wave A retraced the previous bull leg by 64.85% and fell to 2763.65.
Wave A took 14 months.
In 22 months Wave B retraced Wave A by 99.8% (nearly 100%)
So Wave A>Wave B. So far it is following the pattern of a normal or common Flat.
Wave C retraced Wave B by only 44.80%.This makes the counter move which is D as quite bullish.
Wave C had taken 12 months, which compares well with the 14 months taken by Wave A.
We are currently in Wave D. Wave D is an impulse wave so far.  When wave D reaches 6131.48 it would have retraced 99.8% of wave C.
In the diametric of 1992, we had seen that D wave did not go above B wave.
The interesting question is “Since C wave had retraced only 44.8% can wave D go further than the November 2010 top?
2013 shall provide the answer!   
The next chart provides one possibility….


Saturday, December 22, 2012

Nifty Astro Technicals Dec 24 to 31

We are now about to enter into an  energy filled Astro week.Three major aspects and three major lunation are coming together.It is interesting to see both Pluto and Uranus connecting with Sun when Jupiter and Venus oppose each other. Taxation, reforms,large debts, currency value and deleterious effects of excesses are all signified here.End of the year 2012 is so crowded with powerful energies in conflict to one another. Just see how it reflects the actual realities of fiscal cliff related worries, which are a combination of debt and taxation worries,wildly fluctuating currencies, unprecedented balance sheet expansion both in the US and in Japan apart from recessive tendencies in major parts of the world, including Europe and the US.
Technically Nifty signified that wave 2 is not yet completed and one  down-leg seems to be pending.  The larger trend still points upwards and possibly the third wave will coincide with a resolution to the fiscal issue globally.

Thursday, December 20, 2012

Nifty Astro Technicals- Jupiter Play

One of the most important questions engaging the attention of all those who have been trading or investing in the capital markets is,
Whether the market is going to top out soon?
Despite weak fundamentals and economic conditions, will the liquidity sloshing around as FII Investments push the market higher and higher?
Now, since the planet of expansion and  growth has always been primarily Jupiter, I just checked out similar  positions  of Jupiter in the past....
Here is an interesting analysis....

Given the Elliott wave theory expectation of a topping out imminently or shortly hereafter, this looks pretty crazy.
I just looked to see how the Sensex behaved when Jupiter was in Taurus in previous two instances...

  Was there any instances of topping out, when Jupiter moved to the next sign, which is Gemini?
Yes. There were two instances.

Compared to the corrections we were to see later these were not spectacular, but I guess when the action was happening, at that time period it might have been overwhelming.
Will history repeat itself? Only Time will tell!

Two Investment Buys

Here are two stocks which have begun their third waves. They are good investment buys for the medium term ( 2 to 3 months.)


Monday, December 17, 2012

Nifty Astro Technicals Lunar Declinations Dec 17 to 21 2012

Moon reaches its maximum latitude on December 17. Effect to be seen on December 18.Moon and Uranus have a declination conjunction on December 19.December 20 is a first quarter Moon day.
Maybe we will have a reversal break out on December 18-20 ?

Nifty Astro Technicals for Dec 18, 2012

In our December 14 post, we had hinted about indecisiveness in Nifty movements. Well, it turned out that a triangle has manifested in the 15 minute chart. The most interesting question is whether wave 2 of 5 has been completed? We will know if Nifty makes a faster bullish retracement out of the confinements of the triangle.If so, that could be the beginning of the third wave of 5?


If Nifty breaches 5880 tomorrow, we can reasonably be sure about 3 of 5.

Nifty Astro Technicals-YODs

On December 21, a very long time cycle which began on August 11, 3114 BC is coming to an end.On December 21, the Winter Solstice day Sun will be aligning with the plane of our Milky way, a very rare celestial occurrence.
During the same period we have some interesting Astro forms..........
As far as the markets are concerned, this raises the familiar question whether anything at all has been achieved across the recent years in terms of debt reduction, recapitalisation of Institutions and by printing huge lots of paper currencies.
Price wise this may also indicate, that the market is approaching an important turning point...

Nifty Astro Technicals -A look at Venus Uranus waning trines, over the past few years

Venus and Uranus are coming together in a customary waning trine on December 20, 2012.How were the recent such trines? Let us have a look...

Should be interesting to see what happens this week. Apart from this there are other interesting Astro developments in the coming two weeks...
Trade carefully  because there are simply no guarantees in the market.

Wednesday, December 12, 2012

Nifty Astro Technicals for December 13, 2012


Nifty Astro Technicals for December 12, 2012

In our post on December 09, Sunday, we had expected Nifty to cool off its bullish fervour and be on a negative footing on December 10 and 11. December 12 was when we had expected Nifty to resume positivity ( by reducing negativity considerably ) and from December 13 onwards, Nifty is to resume its upward movement.We had also expected Nifty movements to be a little wild, keeping with the character of extreme declination of Uranus on December 11 and extreme declination of Pluto on December 12.
Nifty did cool off on December 10 and 11. Nifty movements today were wild- hitting a high of 5965 and then reacting 100 points to a low of 5865. Nifty had kept most traders guessing throughout the day,which is very much in keeping with the characteristics of a Uranus day.
Some more gyrations seem to be in store before we resume some more up movements.
Here is the preferred wave counts as of today, December 11, 2012.
The present 2nd wave of 5 ( of C of the Diametric D) seems to be exhibiting complex corrective behaviour.A leg up as b and a leg down as c should complete wave 2 in this time frame before wave 3 commences upwards. Our expected date for wave 3 is December 13.
That the second a of abc formation after x wave, reacted as much as up to 5865, is an early warning signal that the up trend is losing steam and the final topping is not very far away.
It is interesting to look at a fractal similarity seen in daily and 30 min charts of Nifty.


That the fractal in 30 min time frame looks compressed probably points out to the shortening time available for rest of the waves of Wave 5.Sudden sharp falls and increased volatility are hall mark characteristics of 5th waves.

Let us look at another long term fractal. That occurred in the Sensex between 1992 and 2003 and compare with the present period.

If we assume a similar retracement of 96.8% or thereabout,  Sensex should touch 20917, which is another 1355 points away.
Will History repeat?

Sunday, December 9, 2012

Nifty -a Few Technicals


Nifty seems have completed wave one of 5 and may have started on wave 2 of 5.Indeed after a rise from 5548 to 5949 ( about 401) it is healthier to have a correction.We had an intraday fall on December 06, but a correction on closing basis is still to happen.Since this rise from 5548 has already consumed 12 trading days, a correction is due time wise also. Looking at the technicals the correction in the form of profit taking may be swift and sharp with recovery in the form of 3 of 5 continuing the current up trend.
Here is an intraday Fibo picture....It is interesting to see the intra day correction falling exactly to 23.6% levels.
On the weekly charts, we are beginning to see the beginnings of a negative divergence with the 9 period RSI...
While it is too early to react, it pays to be a bit more cautious, going forward

Nifty Astro Technicals December 10 to 14, 2012