Pages

Sunday, March 31, 2013

Astro Technicals April 01 to 05 Wave counts

We have now two live possibilities.
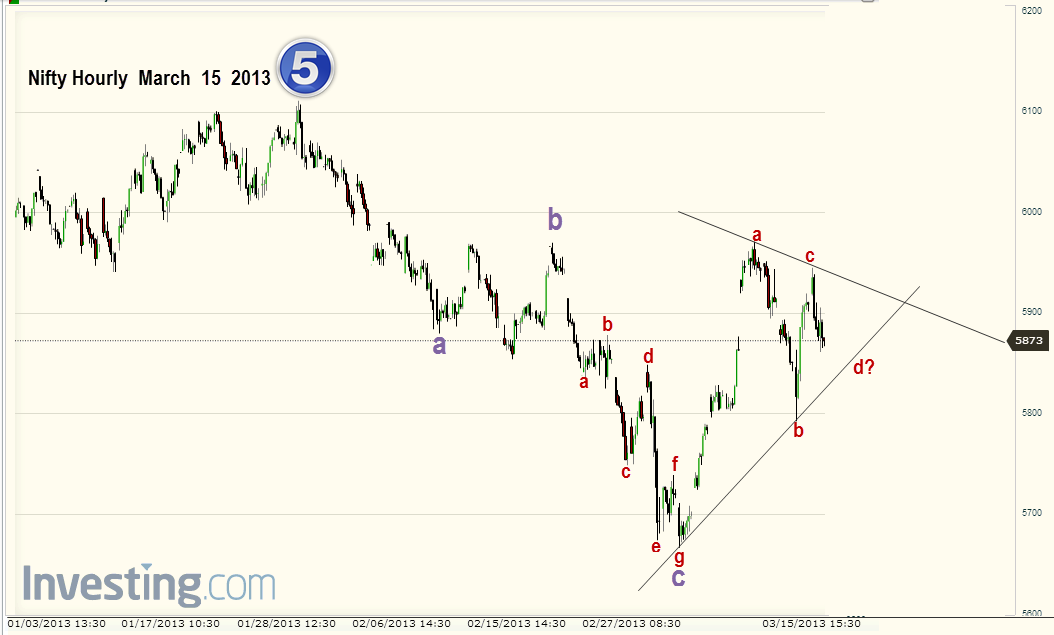
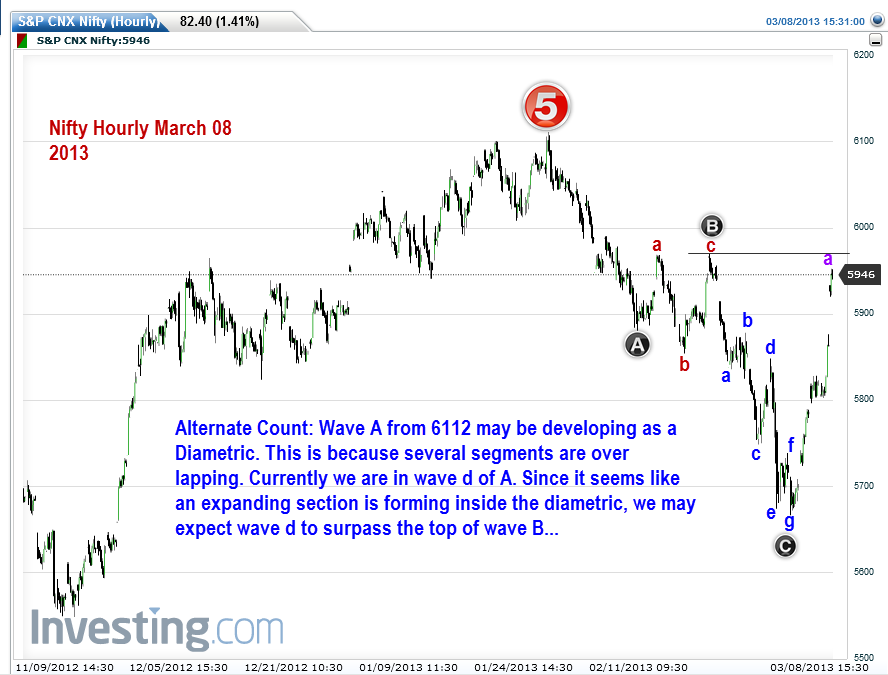
1.Wave e ends on April 1 and wave f of a diametric starts for the week, upwards. From April 08, wave g downwards begins and ends in the middle of the month. That would conclude wave A and from the second half of the month,we begin the more complicated and time consuming wave B upwards.
2.Wave e ends down as an expanding triangle, with a fast down move on April 01 and from April 02, wave B begins.
So the action of Nifty on April 01, shall give us the clue.


The ending diagonal shown below,does not suggest an expanding triangle closure, but then there is nothing to stop Nifty from having one more  down move to the down sloping trend line.


Nifty Weekly Fibo charts show Nifty taking support close to the 38.2 % line.Wave A could end somewhere close by and the wave B upwards could coincide with a blow off kind of move in the US Indices.


The chart shown below is a quarterly chart of Nifty.Nifty had moved below the 5 Q High EMA when it moved beneath 5865 on March 18, with a gap and it closed below the 5QHEMA at 5682.55, on   March 28, 2013.Levels to watch out for the coming quarter are 5455 and 4976.These may happen post May 31, when Jupiter moves out of Taurus.


We hope to see a month with plenty of action. Volatility  could be high. Stay with stop losses and stay with the trend. It is good to know the direction beforehand but it pays to follow what Nifty does on a day to day basis.

Wish you all a wonderful month of trading in April 2013.

Astro Technicals for the week April 01 to 05 2013

This April the world gets into an action mode. Come April 14, the day when the Sun moves into Aries, the action zone, it will have two more companions in Mars and Venus alongside.All the three of them will oppose Saturn first and then Rahu in Libra by the month end.Increased volatility and sudden developments are to be expected.Sun is into its exaltation and so Government initiatives  to resolve economic difficulties may be seen, but there may be powerful opposition from the masses for any taxation or austerity measures. 
With Sun, Mars and Venus all in Ashwini from April 14th, the Indian New Year should start on a bullish note.  We may have to watch out from April 22 onwards, when fist of the trio, Venus  opposes Saturn....
Let us begin from the beginning....
We start with the Moon charts:
 The little blue circles are turning dates for the market.The small red squares are dates of extreme declination of one of the planets. April 1 is Venus, 13 is Pluto and on 28, mighty Saturn goes into extreme declination.
From a trading perspective, April 01, may see a low formation. Markets may open higher and then fall back.Since April 01 is a turn date, if technicals agree, we may go long. If Nifty moves up, keep moving the stop loss upwards till March 05 or 08.Once we are stopped out on April 05 or 08,then simply go short.
Again if Nifty falls keep dropping the stop loss as well till Nifty stops and reverses. Possibilities for SAR increase from April 13 th onwards.In other words, from April 14 we must be long in the market, with stop losses of course.

Let us look at the astro charts :

So the Astro charts seem to agree with the lunar charts.
How were the Sun Venus and Mars Venus conjunctions of the past?


Sun Venus conjunction happened on March 28, around 15.30 pm. We all saw what happened to Nifty in the closing hours on Thursday. Since these are fast moving planets what we see are short term reversals.
Let us also look at Mars Venus conjunction, which is slated to take place on April 06, 2013. ( April 06 is a Saturday, so effects are to be seen on April 05 and April 08, 2013.)

We see the trend taking a dip and then continuing. So we expect the week April 08 to 12 to be a reaction week and then the up trend which seems to be ready to begin from April 02, to continue from April 15 onwards.
How does all this look from a technical perspective?

See the next post.

Wednesday, March 27, 2013

Astro Technicals March 26 2013

Sun proved positive whereas Venus was negative for Nifty.There seemed a small pause in the down move but make no mistake, we are still in the down tend. This is expected to change in the first week of April, 2013, when the tight planetary aspects give way.
Wave wise, it appears that the complex correction continues to move down the channel in a falling wedge.May be there is one more down move on the cards before we finally put down the alphabet e.( for e wave).Whether we will have two more legs ( smaller than e) - f upwards and g downwards or we begin Wave B upwards, remains to be seen.

It is fascinating to observe S&P operate a wedge of the diametrically opposite type as seen in Nifty. We see a rising wedge in S&P....

Meanwhile, a wonderful Holi for one and all...Let the hair be let down and let the Universe dissolve in riotous colours...which will permanently remove all drabness and dreariness from our lives!


Monday, March 25, 2013

Astro Technicals March 25 2013

Nifty bounced, but not high enough.So the wedge continues to form and define Nifty for the moment.I expect another jump in the same fashion tomorrow..Time has the answer.
 As mentioned earlier, it is a time for cautious trading. Several energies are at cross purposes.

Sunday, March 24, 2013

Systemic Market Damage


Lunar Lamps for Sensex Highway March 2013


Astro View for the Week March 25 to 29 2013

The skies look pretty interesting this week. Several planets are getting involved with one another. When fast moving planets connect with existing aspect between two slow moving planets, aspect effects of larger planets start manifesting sooner.
The theme of recent by gone days was suddenness.
Cyprus suddenly entered our consciousness. DMK debacle was also a sudden development.This is because Uranus is involved with Mars, Venus and Sun, all in Pisces.Pisces as a sign is indecisive.So that could well be the theme the coming week. Since Pluto is involved the underlying issue is always going to be debt or threat to established power. With Saturn also aspecting Pluto this could be the beginning of change for may corporations and even Governments.
Astro charts with comments for some of the upcoming days is given below:


   Since there are several elements at cross purposes, wanting to influence the market, it is imperative that the price movement is watched and steps taken after Nifty moves in the direction expected. Also it is pretty dangerous especially now to not use stop losses.
 Have a great week of trading!

Saturday, March 23, 2013

Astro Technicals for March 25 2013

It was a clear week of down trend in the Nifty.

Count wise, one more x formation is on the cards. Technically there can be one more.Iam hesitant to put a bottom yet because the Astro indicators are not yet positive.After the bounce up there may be one more down move. We will see this in detail in a later post.
Possibly we are nearing the end of the present down move.

 5815 is just an upper limit. Expect Nifty to turn down sooner also.Bounce could last for 2 days.That should also account for short covering.
Still it is better to wait for a direction from Nifty. Whatever I had mentioned above are simply directional expectations. If Nifty moves as indicated then for short term we can go long, with strict stop loss of course.If the stop loss triggers, then the above analysis simply did not hold water and in that case, reverse your position and go short.
This is the best way to use all analysis. If we remove trading in anticipation, we are sure to make money.

Happy week end!

Friday, March 22, 2013

Astro Technicals for March 22, 2013


Astro Technicals for March 22 2013

Nifty decided to do the bounce and breaking down to newer lows, on the same day itself.Wave e is defining itself.With Jupiter and Saturn getting into a negative 150 degree position and Mars approaching Uranus for a conjunction, it is advantage bears for now.
What will be the effect of a Sun conjunct exalted Venus? It should be interesting to see.


In this 5 hourly chart, see how Nifty pulled back to the violated Gann angle line and then fell again? The 25% line also has been breached..so sooner or later we should see the testing of 5548.Our strategy of sell on rise continues.

Wednesday, March 20, 2013

Astro Technicals for March 21 2013

We saw how much effect singular celestial bodies can bring about, when its energies are cleanly transmitted. Next week we have several aspects and signatures as pointed out in last week end posts.Let us look at the technical charts..
There are possibly two more legs for the current wave e ( it can get complex and produce several more, of course) and that could end the expanding triangle from the top of 6112.Probable time line is first week of April 2013.That is when the negative effects of Saturn-Pluto 150* aspect as well as the Pluto-Jupiter 150*aspect will start waning and Mercury -Rahu ( Northern Node ) trine gets going.Meanwhile a small bounce which is over due should provide one more opportunity to sell on rise again.

Tuesday, March 19, 2013

Nifty Astro Technicals March 19 2013

As expected Nifty breached 5815 and went down into the 5700s.  Hawkish guidance by RBI, Government attempting to rob citizen depositors in Cyprus, DMK pulling out of UPA...for Technicals and Astro Analysis, these things do not really matter..All we are interested in are the price movements.
The extent of the drop makes us look at the labels ever so slightly..makes us  expect a small bounce before the next plunge....
    
One of interesting theories of Astro Analysis is that if we have one or two planets alone forming aspects or being involved in the dynamics of the movement then those planets acquire the power to give results for the movement. And so Moon alone with its vagaries produced a stunning fall today.

And we are not the only ones with such a tendency..
Look at S&P..

Trade safely..There really is no hurry to make money.

Astro Technicals for March 19 2013

As expected Nifty opened gap down, but did not breach the all important 5815.We may see the breach on the morrow and also some recovery. Things like RBI Policy days are bad for trading  because of too much of volatility.Best thing is wait till the market makes up its mind and then follow. I still feel that the downside potential is higher, but then you never know..

Sunday, March 17, 2013

Nifty Wave Counts- Some Alternatives


You don`t want me to elaborate on these charts do you? They are quite simple and straight forward..

Nifty Some more Astro- March 18 onwards...

For a change Iam using Zero Ayanamsa, which means the above charts will somewhat resemble western Astro charts.
In the chart marked as A, on March 23, 2013, Saturn and Jupiter will be 150 degrees away  which is a long term negative aspect.Moon meanwhile is perfectly placed to translate the energy.At the same time, Uranus and Mars are becoming conjunct in Aries.A sudden down move which can continue, cannot be ruled out.
We move on to Chart B by March 27, 2013. It is a Full Moon.Mars squares Pluto. By forming a sextile with Jupiter, Mars conducts the square energy to Jupiter as well. This makes the aspect formation as negative. However Sun and Venus form a conjunction which could counter the negativity. We expect more volatility with up moves followed by swift down moves or vice versa.
By March 29, 2013, Sun, Venus and Uranus are all conjunct. Mercury forms a square with Jupiter and conducts negativity to Pluto by means of a sextile with Pluto. I cannot think of any positive vibe with this formation.
By April 01, Sun and Venus also square Pluto.Mercury square with Pluto increases in intensity.Nifty may move down a bit.
As I had explained couple of posts earlier, Lunar effects are also not very positive this week. ( March 18 to 22).But then the formations are not strong.Even if we have buy positions now, maybe we should think of squaring off by the weekend because the the heavens are quite busy next week, which we  just  saw.
It is not a to be brave or complacent.Have strict stop losses and act only after the price moves in the anticipated direction.
Have a great week of trading!

Nifty -Some more technicals March 18 onwards


The retracement from 5663.60 to 5971.20 was of the order of 68.63%. Overhead Gann Resistance now lies at 5966 and the Gann support now lies at 5791, both for the   forthcoming week.
As per Western Astrology calculations Sun enters Aries on March 20, 2013. We already have Uranus and Mars there. Sun will add to the energy and things ought to become even more volatile for now.
Make a note of this Full Moon on March 27 th and the circled date of April 01, 2013.
We will see why, a little later.

Let us have a look at some pitch forks. I have considered this from the lows of December 2012. Nifty has now violated the 161.8% extension of the blue pitchfork. So we conclude the trend is clearly down. I have also marked two long term Gann lines in black. The resistance for the month is at 6059 and the support is at 5674. If this is broken down then Nifty could swiftly move down to 5426.


In our post captioned as , 
Astro Technicals March 11 to 15 2013, this is what we had expected....

".....Nifty may improve from March 06 onwards and possibly accelerate from March 09 

onwards.

Nifty did precisely that. The acceleration took quite a few people by surprise. However we 

still feel it is not an impulse movement but a corrective one.The current up move could either 

be Wave B or Wave d of Wave A itself, where in the latter stage we assume Nifty is in a 

diametric down move.

If we consider the Fibo retracement, then a 76.8 to 80% retracement should mean that Nifty 

may cross 6000 once again,comfortably this week. 

What does Astro indicate as a possible top formation time?


It looks like reversals are likely only during the week March 18 to 22.Lunar indicators are 

gathering once again from March 18 onwards. Mercury is becoming direct.

A curious thing is that in the New Moon chart for March 12, 2013, the luminaries Sun and 

Moon are square the natal Sun and Venus at New Moon moment.Iam not clear whether this 

means a sudden drop sometime this week followed by a recovery. It should be interesting to 

watch.Even if there is any dip my bias would be to buy the dips..." 


Nifty improved from 5th to 11th, where 11th was a turning day.Just as we suspected, around 

the New Moon day, Nifty reversed powerfully and fell from 5971 to 5791 between 11th and 

14th intraday,before reversing again to form a high of 5945 on March 15th before closing 

lower at 5872. For the week, it formed a higher high and a higher low but closed 73 points 

lower than the last week.

Quite bizarre and in keeping with Sun -Moon squaring Natal Sun and Venus.


Let us look at the week beginning March 18 and ending March 22, 2013:


First quarter Moon is on March 19th.Moon Apogee and Maximum declination also is on 
March 19th. Sincethere are no planetary signatures are import this week ( we have quite a few next week) we assume that the Lunar effects will drive the market.

So March 18 and 19 could see the down trend continuing and March 20 could be a positive 
day. March 21 again could be a negative day with prices recovering on March 22

This is at best an informed assumption.So please follow the price.
Technical picture is as follows:

 
After achieving equality with b, the current d wave has gone into a triangular huddle.Last two legs of the triangle may be shorter with reduced volatility, but once the triangle breaks the move could be swift. 
With Mercury becoming direct we think the down trend could resume in a gentler fashion.


Sunday, March 10, 2013

Astro Technicals March 11 to 15 2013

In the post for March 04 to 08, this was our observation:


We have a Minimum declination occurring on March 05. Moon Perigee on March 06. We have a Moon Perigee on March 06. Mercury reaches extreme declination on March 07.Maximum Latitude on March 09.
Nifty may improve from March 06 onwards and possibly accelerate from March 09 onwards.

Nifty did precisely that. The acceleration took quite a few people by surprise. However we still feel it is not an impulse movement but a corrective one.The current up move could either be Wave B or Wave d of Wave A itself, where in the latter stage we assume Nifty is in a diametric down move.


If we consider the Fibo retracement, then a 76.8 to 80% retracement should mean that Nifty may cross 6000 once again,comfortably this week. 

What does Astro indicate as a possible top formation time?


It looks like reversals are likely only during the week March 18 to 22.Lunar indicators are gathering once again from March 18 onwards. Mercury is becoming direct.


A curious thing is that in the New Moon chart for March 12, 2013, the luminaries Sun and Moon are square the natal Sun and Venus at New Moon moment.Iam not clear whether this means a sudden drop sometime this week followed by a recovery. It should be interesting to watch.Even if there is any dip my bias would be to buy the dips. 

Mean while the S&P is interestingly poised...It is entering the blow off part of an expanding triangle....


Have a great week of trading!

Wednesday, March 6, 2013

Nifty Astro Technicals March 05 2013


Here are the preferred wave counts. Looks like the corrective Wave B has begun.More confirmation will be forth coming when Nifty crosses 5853 on the upside.