Pages

Sunday, November 30, 2014

Nifty Astro Technicals Dec 01 to 05, 2014

Last week we suggested that the market is bullish and not to short anything. True to our expectations, Nifty went on to surpass 8600 before closing at 8588.
We also surmised that the Uranus Pluto square is inexorably pulling up prices and with this square very much in formation, there is no question of any correction. This despite several negative set ups from short term planets.
But now the short term planets are beginning to turn positive as well.
On November 26, Uranus trined Venus.
By December 01, This Venus will trine Ketu also.
And by December 05, Venus will trine Jupiter, which has slowed down considerably, in preparation to its yearly retrograde motion.On the same day, Sun will trine with Uranus, another powerful combination.
By December 09, Sun will conjunct with Mercury and Jupiter will turn retrograde.This will be the first indication that the trend is fast maturing.
And of course we have Pluto Uranus square on December 15th.
So the short term planets also join in the positivity..
Trend continues to be up and from December 08 onwards, we have reasons to be cautious about..

Nifty daily cycles also agree..Cycle on Nov 21, was an inversion. So the cycle at December 24 will most probably produce a bottom. Red cycle of 108 days has been hugely right translated. So we expect a top somewhere between December 15 and 24, most probably by December 19/20.Since the current cycle was so right oriented, we expect a shallow correction for about 4 to 5 days and then the next upmove should resume again.


We can see how Neo waves also agree.Currently we are in wave 3 of wave 5 of wave c which is the last leg of wave a of the 2nd x abc combination.So after this wave a of xabc ends, then b of xabc should open downwards.Cycle s2(po) has now commenced on the hourly charts.Since there are only 2 x waves allowed in a complex correction Wave F should end when the current, 2nd xabc ends. That should be in the first quarter of 2015. However, since the markets have run up so much,  we should be prepared for any aleration or deviation.


Meanwhile the last month of the year is just about to flower...Markets are cheerful..they may become exuberant at any moment!
So happy and safe trading.

Thursday, November 27, 2014

Stock Ideas Canara Bank


Biocon updated November 26, 2014


Astro Technicals of Dow Jones

Dow Jones, one of the oldest of indices is a good barometer of the US Financial Markets and a strong fore runner for other financial markets of the world.
Here are some charts of Dow Jones...

On a monthly scale, Dow has been correcting since 2000.It is currently in the D leg of what looks to be a huge  diametric. If it is going to be a diametric, we may see three smaller legs, E down, F up and G down, before the pattern is completed.D leg is close to topping out and we could see a good down move in the form of E. But E may not be as severe as wave C.This may happen in the first or second quarter of 2015.


If we shift to a weekly basis,expand the chart and look at the developing wave D closely, we see that it a double diametric so far, connected by an x wave. Since it is perfectly channeling, this is not an impulse wave.Currently we are in wave g, which may top out around 18000. After that either wave E down could start or we may have another x-abc development inside the channel itself, before the top out occurs. Latter option seems to be more plausible as of now.At the time of this article, Dow is around 17800.
Here is an  angular chart...

18000 seems to be the immediate top resistance, after which the move could continue with ups and downs till 22000, sometime in 2016.

Sunday, November 23, 2014

Nifty Astro Technicals for November 24 to 28, 2014

Last week we observed that the market is long term bullish and unless 8415 is taken out decisively with good volumes, we expect a downswing. There were several astro aspects which were pointing out to a negative outcome by way of a short term top...yet, Nifty after a fair period of consolidation, managed to  move into positive territory by crossing 8415 decisively.
Interestingly all the square aspects of Venus with Jupiter, Sun with Jupiter, Mars with Rahu and Mars with Ketu, could only cause a prolonged consolidation for 11 days..in other words they could only cause a time effect and not a price effect. This phenomena happens once in a while, when there are other larger planets involved in the picture, causing bullishness. When the faster planets complete their formations, the larger planets take over.
See this chart....
We can see that the market races up every time there is a Uranus Pluto square being formed.Magnitude of ensuing correction depends on the other planetary energies being manifested, after the Uranus Pluto square.Being slow moving planets affecting long term trends of all walks of humanity, when they are in aspect, smaller planetary aspects in the opposite direction will not be very effective. That is why so many related negative aspects could do little other than cause a pause and a consolidation ( that too a positive consolidation for 11 days!). The last formation is on March 17, 2015..which means the markets could be racing up for the grand finale then.( Curious to see that this phenomenal and rare formation begins with an 8, June 26 and ends with another 8, March 17.)
Which means after December 15, we could see some consolidation or reversal for the breath taking upmove so far.From December 04 onwards, smaller planets are also getting into positive mode, so from an astro point of view it is only buy on dips..No shorts whatsoever.
Technically,

Here is an updated chart  of Neo wave counts, where I have also shown the cycle phenomena.
It is now confirmed that wave a of the 2nd x-abc formation is an impulse and is embarking on the 5th wave, Minimum target is 8600..this wave 5 inside a could show equality with wave 1 inside  a, because wave 3 was an extended affair. In rare cases wave 5 also could extend apart  from wave 3, but such an euphoric situation is not seen now. That could only happen when FIIs, DIIs and the retail investors all become buyers at the same time..which is obviously not the case yet.
Nifty has moved out of the upward channel which is a clear bullish sign.The trend will reverse as a correction when the final wave 5 is retraced in faster time and the x trendlines are pierced downwards.
Looking at the cycles, I have rounded all 23 day cycles which have shown inversions.We have just witnessed another one now. The cycle after the inversion has been seen to show a downward correction.
If we look at the 108 day cycle, we can see that it is forming a huge right translation.. This means the next cycle of 108 days will also probably be bullish to begin with.This also means that the corrections when they happen are going to be shallow affairs, till the cycle tops out. I have shown the cycle diagram as ending near 7600.This does not mean the market will come there. It is just a figurative representation of the cycle in operation.

Here is an expanded view of the present wave a of 2nd x abc.

The hourly chart also tells the same story..
Happy and profitable trading!

Tuesday, November 18, 2014

Mars in Sagittarius-across the years

Gann gave a lot of importance to the movements of Mars-he considered it as a market planet.He refers to Mars as the "Key" to market moves in the short term.
So what was the market effect when Mars was in Sagittarius, over the years. I have compiled some observations based on Nifty movements.

I have clubbed together the years Mars was in Sagittarius-1996 to 2001 into one chart here. We see that in those years every visit of Mars in Sagittarius was seen to cause a significant drop or bottom formation.In the initial years there used to be a secondary bottom when Mars was in Capricorn or Aquarius but in later years, after Mars left Sagittarius, we see significant recoveries happening. Important thing here is significant bottom formation in Sagittarius. 
 In 2003, we did not see any significant bottom formation, that actually shifted to Capricorn. So something has changed.Let us see the astro charts...

 Which is the closest planet to Mars? It is Pluto. Being a heavy weight planet, it has started influencing Mars.

In 2005, we see a bottom formation before Mars enters Sagittarius and then towards the period Mars is about to leave Sagi, there is another reversal. This time Pluto is only minutes apart, when Mars enters Sagittarius.
Aha! Transformation! Mars is meeting Pluto in Sagittarius. Since Pluto is such a slow moving Planet, its move into Sagittarius from Scorpio. is a massive shift..several new trends are getting set up here.In hindsight we know that all subprime was about to boil over in a year`s time!
Anyway the trend is that we get a bottom when Mars enters Sagittarius and also a smaller top when is is closer to the exit from Sagi.

Here the regular pattern has got hugely distorted by the "crowd" in Sagittarius and Capricorn..an important lesson for us as to what happens to trends when there is overcrowding of planets with different kinds if energy all jostling together.Still we see a dominant trend of reversal closer to Mars exiting Sagittarius.

In 2010, we are back to the old pattern..A bottom formation just prior to Mars in Sagi, followed by an uptrend and then a beak down closer to Mars exiting Sagi.
 And in 2012, nothing much has changed..Two bottoms one prior and one after Mars  in Sagi, then a rise and importantly, a drop just before Mars leaves Sagi...
And now in 2014...
True to form we had a bottom just before Mars entered Sagi, on October 17th, and then a spectacular rise.Most consistent has been that there be a reversal before Mars exits Sagittarius...There are 8 more trading days before Mars exits Sagi...
Will there be a fall? You judge!There are enough other astro reasons as shown above....     

Monday, November 17, 2014

Nifty AstroTechnicals for the week Nov 17 to 21, 2014

The rapid rise trend which was seen from October 17 till November 03rd gave way to a sideways trend with a slight positive bias.
So what do we expect next?
In our blog post of October 13, itself, the week when all markets were falling and everyone was saying that the bull market is finally over, we had shared this chart...
Our take then was that this present bull move will be challenged only in 2015..there is absolutely no change in the expectation.
If anything, Nifty`s movement after October 17, has only strengthened our expectation.


Here is one more chart which gives another perspective of our understanding....

We are in a long term bull market and we expect this bull market to last till May or June 2016. We also expect a big correction and some complex monthly moves from January 2015. This could possibly be wave 4 of the  impulse or wave G of the diametric correction which is ongoing.Interestingly, we are in the 261.8% time extension of the 2011 correction right now. So a turning point is close by.  
While the very long term is quite bullish,  the near term plays a slightly different tune...
Look at the daily chart here...
It is pointing out that possibly 8415 is a near term top and without a down move to 8120 or 8080 levels Nifty may find it difficult to cross this top. This month end or the first week of December could be the start of the next big upmove. Weekly momentum is still on an uptrend though the daily is showing signs of tiredness. Unless there is a huge upmove with big volumes, taking out 8415 decisively, I would stick with an expectation of a downswing now.
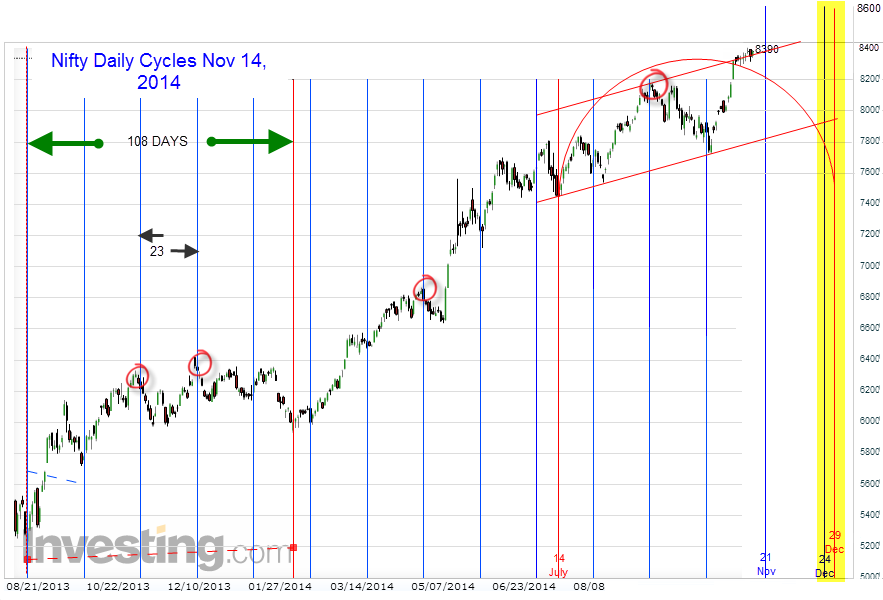
Here is a chart of Nifty daily cycles...

We see that the next 108 day cycle bottom is towards the end of December, 2014-between December 24 and 29, to be precise.Next 23 day cycle is due on November 20/21 and going by the looks of Nifty moves, we are due for another inversion.Infact all inversions in 23 day cycles have been rounded and shown in the chart.We see that after two consecutive inversions, Nifty tends to go down and form a proper bottom.So a down move after a peak around Nov 20/21, seems possible, as per this chart.
Looking at the 108 day cycle currently in operation, it is very much a left translated cycle. So Nifty will be going up initially, in the next 108 day cycle commencing on Dec 29 or thereabouts.
Hourly cycle chart presents a very interesting picture.


1.147 bar cycle has phased out to November 07, from November 03.On its rebound  as s1(po) it is yet to gather momentum. This lack of momentum is a little bearish.
2.If we assume that cycle s ( 147 bars) did not phase out then we follow the red cycle. If so this cycle is due on November 18..and so could cause a pause in Nifty movements upward.
3. If we consider the r series of cycles, shown in blue, then the r2 phased out cycle is showing a central translation from the strong right translation seen earlier. This means a correction is due on Nifty.
Major cycle phasing out has caused this change in trend in Nifty. 
Wave wise, we are in the second corrective x. We had completed wave a, which was those huge gapping up moves and had started on wave b. This was the boxed in movement we are currently witnessing, between 8290 and 8415. Expecting one more down move to complete wave b. After that wave c upwards should continue.
We may also consider the entire move from 7724 as impulsive..In that case the boxed in movements are of wave 4 and here also we arrive at the same conclusion..one more move down is pending..after which wave 5 upwards should commence. 
To sum up:
a.Long term movements of Nifty are bullish. 
b. An important medium term top is expected sometime in January 2015, after which a meaningful correction should commence.
c.Daily and hourly cycles are pointing to an immediate down move after which the upward trend should continue.
d. According to Neowave, whether we are in the second x-abc formation or in an impulse move post 7724 bottom, a down move to complete wave b or wave 4 is pending. After which wave c upwards or wave 5 upwards should commence.   

Astro Wise, there are no changes in our views, from last week:


 On Nov 10, Venus and Jupiter were square. Mars and Pluto were conjunct. Effect dates are between Nov 18 to 20.
On Nov 13, Sun and Jupiter were square. Mars and Uranus were square.Negative effect maybe seen this week.
On Nov 19, Moon and Rahu square Mars in Sagittarius. Another negative development.
On Nov 19, Mars squares Ketu. 
From Nov 19 onwards, Jupiter becomes an 8th house significator.

Astro Wise also this week seems to be negative.Let us be cautious with long positions this week. 
Happy trading!


Sunday, November 9, 2014

Nifty Astro Technicals- Astro picture Nov 10 to 14 2014


Nov 10 Mars conjunct Pluto. Ketu Jupiter trine ends. The trine formation of Venus and Sun with Neptune will show its effect this week.
Venus square Jupiter
Nov 11 Moon opposes the Mars Pluto conjunction
Nov 12 Sun starts to square Jupiter
Venus moves into Scorpio. And begins to conjunct Saturn. Mars begins to oppose Uranus
Nov 13:By the week end, Sun will be in firm square to Jupiter.
Neptune also goes into deep declination this weekend, before turning direct next week.
Long suffering Librans have Venus, Sun and Mercury moving through their signs this week. Soon all these planets will move into Scorpio and Librans can heave a sigh of relief.
For the markets, all the formations indicate a reversal of the existing trend. It could be another collective downswing in all indices, with Nifty and Sensex swinging down lesser than others.
Since planets are moving out from the sign of balance into the sign of aggressiveness and intensity, volatility can only increase from now on.
In fact negativity in one form or other will be present till December 04, 2014.But we are still in a long term uptrend because the biggies are yet to commit to one another.

This matches with the technical pictures as well…so take care with your longs.

Nifty Astro Technicals for Nov 10 to 14, 2014


Here is a chart of Nifty Fibo levels:
The current wave has consumed nearly 50% time of the previous wave and is yet to begin any retrace.
Looking at the daily cycles, the 23 day cycle has consumed 14 days so far and the momentum has now tapered down.23 day cycle has another 9 more days to go.Perhaps this is why the hourly cycles are so phased out by now,Interestingly the 23 day cycles also show  more inversions  compared to the larger 108 day cycle which seems to find bottoms at regular intervals.The next 108 day cycle bottom is around December 24, 2014.

Sunday, November 2, 2014

Nifty Astro view for November 2014


Nifty Astro November 03 to 07, 2014
Most significant change this month is that Saturn moves into Scorpio.
On November 02, 2104, Sunday, at 02:05:45 am, Saturn moves from Libra into Scorpio. He remains in Scorpio, till October 25, 2017, Wednesday, 03:37:53 pm. That is for a full 3 years.
Early part of the week will be dominated by the effects of Venus and Sun respectively in waning trine with Neptune
By November 3rd and 5th, both Venus and Sun form trines with Chiron, another slow moving celestial body.
By November 9th, Venus squares Jupiter.
By 10th, Mars conjuncts Pluto and on 12th, he squares Uranus. The month long Ketu- Jupiter trine comes to an end.( crest  by 18th or stronger trough)
By November 12, Venus conjuncts Saturn in Scorpio.
By November 13, Sun squares Jupiter.
By November 18, Sun will conjunct Saturn.
On November 20, Mars will square Rahu and Ketu. On the same day, Venus will square Neptune.
On November 26, Venus will trine Neptune. On the same day Sun will square Neptune. Next day Venus will square Chiron.
Meanwhile Uranus and Pluto will be moving towards their square formation on December 15, 2014.  

In short, we are going to see a time band where faster moving planets will mostly conjunct and square the slower planets.
Both Venus and Sun trine correlates with some topping action. So the present optimism in the markets may persist upto November 07th. (07th also happens to be a Full Moon. So reversals are a possibility.) Thereafter, weaknesses would begin to manifest. Since Jupiter trine with Ketu will be removed, by November 10th, optimism will start reducing. We are still awaiting the bottom formation after the recent Solar Eclipse. But there could be heavy volatility in the week 10 th to 14th and then some stronger declines.
It looks like we will have an important top in November 2014 which could form a bottom by first week of December 2014.
In effect, upto November 07/10-optimistic.Unfortunately, we have only three trading days next week.
Of the three, only November 07th looks positive.
November 10 to 18- dualistic. (Between 15 and 22, three major planets have their extreme declinations. Neptune, Saturn and Pluto.)   
November 19 th to December 04-pessimistic.
This is our take for November 2014.
Nevertheless, unless the market takes a turn we will not initiate a trade. No anticipatory trades for us.


Saturday, November 1, 2014

Nifty Astro Technicals Nov 03 to 07, 2014

We saw an unbelievable week of trading go by. Markets all over the world just exploded upwards, catching most people by surprise. FOMC`s withdrawal of QE hardly made any ripple while the Bank of Japan`s reintroduction of QE was wildly welcomed.
As usual we will see the cycles, followed by an astro update.Since Iam updating nearly regularly, Iam doing away with elaborate week end reports.
Here is the cycles update....
I have cleared up the chart and have introduced a simple nomenclature so that we can follow the cycles easily.We will stay with hourly charts and gradually include daily, weekly and monthly cycles.This is because our primary entry and exit points are the hourly charts.
Our first observation is that
1.Blue cycle r was right translated and predictably proved bearish.
2.Blue cycle r bottomed out at wave point x, on October 17th, along with its sub cycles, p and q.
3.Thereafter wave r1 started.
4.Normally a cycle starts out with some basing formation and low momentum.Often there by a secondary spike down as well.However r1 started off with a gap up, which meant that the momentum in r1 cycle was going to be bigger than normal.
5. We understand a cycle better, by analysing its sub cycles.So we look at p1 and q1.
6.Immediately we observe p1 was a right translation. So we now have two clues, a. p1 opened with a gap up.2. p1 was right translated. So the bigger cycle was going to be bullish.
7. When p1 bottomed out, Nifty hourly did make a few negative bars, around the 8000 level, which actually was the third clue. That if a sub cycle bottom is shallow, then the next move will be  explosive.The converse would be if a left translated cycle makes a lower top, then the decline which will follow ought to be very bearish.
8.When q1 began, the move was explosive. Even after the halfway mark, the wave continues to be heavily bullish.
So we conclude that cycle r1 is heavily right translated and so the next cycle r2 of 80 bars may be bullish.The possibilities of q1,r1 and the larger cycle s getting phased out or postponed is high. This means the cycle bottom may not be on Nov3, but may extend some more days. However, since the larger cycle s is due, a low is definitely round the corner.
From a trading perspective, new purchases may not be initiated. I have shown two parallel trend lines. The third inner trend line is literally skywards. Break of this trend line is first stage confirmation that this cycle top ( not market top for God`s sake!)  is in place.Break of the channel is the second confirmation that Nifty Hourly is looking to form a bottom.Long positions maybe liquidated, but not confident of shorts yet.Since we expect the next cycle also to be bullish, this bottom can be used to re enter longs.
I do hope this format is useful. Please send me your observations.
Do note Iam also learning alongwith you. So any mistakes, errors and omissions may be pardoned!