Pages

Monday, July 29, 2013

Nifty Astro Technicals July 29 to Aug 02, 2013


July 29 2013: Moon is in Ketu star. Asc is in Venus star. Ketu signifies 8 and 12.Venus signifies 12 and 3. Moon moves through the subs of Mars, Rahu and Jupiter. A down day with some recovery post 1.15 pm.
July 30, 2013: Both Moon and Asc are in Venus stars which signify 12, 3 and 10.Moon moves through the subs of Mars, Rahu and Jupiter. Same pattern as July 29. Fall and some recovery post lunch. 
July 31, 2013: Moon in Sun star, which represents 2, 11 and 6. Asc in Venus star which reduces the positivity caused by Moon. She moves through Rahu Jupiter and Saturn subs. So after a flat opening we may see a positive market this day.
August 01, 2013: Moon in Moon star. Moon signifies 9 and 12.Ascendant in Venus star, signifies 12 and 3. Moon is in Mercury sub. Mercury though close to 11th cusp, still signifies only 10.Moon moves through the subs of Rahu, Jupiter and Saturn. Recovery in second half, yet should be a small negative day.

August 02, 2013: Moon in Mars star, predominantly signifying 2 and 10.Venus is in Venus star, signifying 12 and 3, but Venus is also the 11th Cuspal sub lord. So a positive end to the week is on the cards.

We expect 3 days of negativity and recovery in the last two days this week.


Aspects wise, a bottom is indicated by August 07/08.

Happy and safe trading.

Thursday, July 25, 2013

Technical View of Nifty July 25 2013


9 day RSI is about to penetrate 30 day RSI on the downside. This is bearish for the short term.


Broader markets are not participating at all in the current rise. This divergence is also negative.

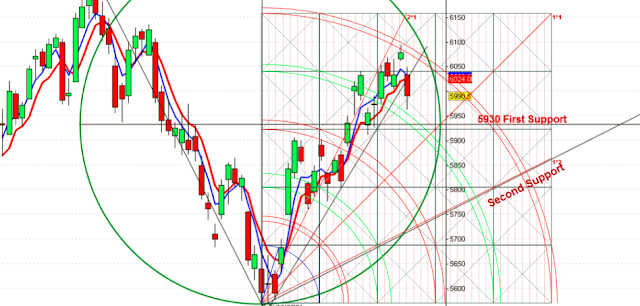
Cycle lines and Gann Supports are shown here. Long term up trend is still intact.

Monday, July 22, 2013

Nifty Astro Technicals July 22 to 27 2013

Last week we were expecting c wave to complete. It had completed 7 days by June 19.

What we now see, is that the abc correction by not breaking the trendline drawn, had become an x wave and so we have another abc correction unfolding.We had completed a and we are currently in the corrective mode, b. We still have one large c up move way to So we continue to hold Nifty buy positions till we see a decisive break down below the 0- b trendline.

Let us look at the cycles...


We see a possibility of a reaction, a buy on dips kind of reaction which could move the market further higher.In other words the c wave could be a strong one coming before the final fizzle takes place.

And astrologically,


We have several significant planetary aspects this week:
1. Mercury turns direct.Uranus has turned retrograde on July 17th.Both planets came close to forming a square and are now moving away from each other.
2.Mars conjuncts Jupiter.Rahu is trine Mercury and the Grand trine involving Jupiter, Saturn, Neptune and Mars is still in vogue.
3. Rahu moves to Rahu star. We already have Mars, Mercury, Jupiter and Saturn in Rahu stars.
4. Rahu is also the cuspal star lord for 3, 7 and 11th cusps.
5.July 22nd is a Full Moon, Moon Perigee and a Minimum Declination day.
6. July 23rd is a Maximum Latitude Day.  
7. By 25th July, Venus will oppose Neptune and Mars will oppose Pluto.
8.By July 26th, Sun will square Saturn
.
Additionally we are in the middle time period of Venus Antara Saturn Sookshma.
So what do we understand from all this?


We see that all Saturn Sookshma periods had a small crest forming. That is the first understanding. Since the Grand trine is still in vogue the reaction of two or three days will reverse once again into a bigger up move.This could last into the week and by 26/ 29, we could have a bigger down turn coming.
Will it mean that the prices will fall into sub 5400 yet?
My take is not yet.
Reason is because of the following observations.
 
Nifty had never reacted significantly ( a sustained downtrend) when fast moving planets were moving in the houses of Cancer, Leo and Virgo.These three houses offer a sort of continuation of the existing trend. So the next real down trend could commence only when Venus conjuncts Saturn and Rahu in Libra followed by Sun conjunction with Saturn and Rahu.These are slated to happen post September 17, 2013.
So, even with dips, Nifty may continue to rise till September 17th ...

Putting it all together, Nifty may first go up and then react. On July 29, a bigger reaction could set in. Even that could be shrugged off and Nifty may move forward to its tryst of Saturn and Rahu. That rise could be the result of the Grand Trine.After which the Jupiter-Pluto-Uranus squares will inject reality into markets.
With so much aspects and signatures, we will  closely follow the developments on  a day to day basis.

Happy and careful trading.

Thursday, July 18, 2013

Astro Technicals for July 18 2013


Current uptrend faces a cycle line on July 22. That is also when we have a few lunar signatures..Mars would be exactly conjunct with Jupiter and both would be in trine to Saturn.

Sunday, July 14, 2013

Nifty AstroTechnicals July 15 to 19

In the week gone by, we saw Nifty break out of the uncertain triangle formation and move up..Technically we see the last leg c of c now unfolding. This week we may see completion of this c leg.
Let us examine in more details...

Last week we were watching to see whether Nifty would resist at 61.8%. Nifty with a gap up climbed above this level, and is now within striking distance of 76.8% retracement levels.Since we had seen a Limiting triangle formation last week, the expected target of  break out is 75% of the largest wave inside the triangle. Since a was the largest wave and it measured 335 points, our limiting triangle target is around 6056, which is quite close to the 76.8% retracement levels also.
Timewise wave a had taken 5 days, wave b 7 days and the developing wave c will complete 5 days on July 17. 


If we examine the RSIs we see that the 9 day RSI has substantially moved up over the 30 day RSI. This may be taken as a bullish development. Now of interest is the subsequent development of 30 RSI and whether the 9 period RSI will make a secondary peak.That could signify a crest.


In the 60 min chart also we see levels of 6050 to 6100 are quite significant. If Nifty vaults over these, then we are in powerful up market. Short term cycle suggests that the uptrend may be over around 6100 levels.


In the post,
where we had discussed reversals because of Saturn direct station, we had expected a turn around July 17, which is midweek currently.This also could get distorted by a few days, because of the
approaching grand trine of Jupiter-Neptune-Saturn.Mid period of the current Venus Antara Jupiter Sookshma also falls sometime around July 22. So the period July 17 to 22 make be watched for a crest formation.


If you had regularly followed the posts, we had dealt elaborately at different times in the past, on these long term formations.
1.On May 30, 2013, Jupiter enters Gemini. We had postulated that the long term uptrend is in danger and that for the next one year, we will see dual trend with a downward bias.This means that after the crest formation immediately Nifty may go down below 5477 levels also.
2.Saturn Neptune Trine:May 12 to July 27, 2013.While the central time band is June 20, 2013, we are seeing the positive distortion effects of Jupiter also joining the trine. Which means the central time band gets shifted closer to the Jupiter-Neptune-Saturn trine. This is around July 17. So between July 17 to 27, this trine should take its effect. Already we find euphoric reactions to developments such as Infosys results.We also note that crest formations due to this combination has a long term effect of one to two years.
3.Jupiter square Uranus square Pluto:August 06, 2013:We saw the waxing square of Uranus and Pluto was in vogue for 72 days from April 18 to June 28.Central time band for this formation was May 20 to 24. Nifty had made a high of 6229.45 on May 20 which remains the highest crest this year so far.When Jupiter joins the square, it could lead to bankruptcy issues around the world which could be the cause of the expected downtrend.
So in a nutsheel, we currently play out the positiveness caused by the Grand Trine and then wait for negativity to set in, when Pluto,Uranus and Jupiter get involved in  a square formation.We continue to hold Nifty and at the first hint of trouble in Nifty, we sell off and switch to shorts later, once the Grand Trine is over.

Happy trading!  

Sunday, July 7, 2013

Nifty Astro Technicals July 08-12, 2013

With several technical and astro aspects crowding in, we are in for quite an interesting time trading wise for the rest of July 2013.
Let us look at the technicals first...

Corrective wave A had taken 49 trading days. Wave B has so far taken 61 trading days. Currently we are in the upward c leg  of wave B.
Nifty had reached 5897 levels, which represent 50% retracement, promptly reacted and is now testing those levels again. If it crosses this level on Monday, July 08, then it should quickly reach 5975 levels which represent 61.8% retracement. Nifty is likely to find big resistance here.
Timewise 68 trading days represent 1.38 times 49, the number of days taken by wave A.This falls on July 17. This is a time zone to watch out in the medium term.  

If we look at the interplay between 9 and 30 day RSI in daily and weekly time frames, we find that 9 RSI has crossed the 30 RSI upwards in the daily and in the weekly, it is yet to do so.So we expect continuation of bullishness but with caution.Things could turn any time.
Here is a chart on Gann Angles of Nifty 30 Min..
So technically we are bullish, but are more like the proverbial cat which is expecting a half brick thrown at it..extremely vigilant...
Now, let us see what our Astro Indicators say...

Nifty should improve for the first two days. 09th July after 11 am, we may see a change in the up trend.By weekend, a short term negative trend may be visible.
Let us check out our retro and sookshma charts..

As mentioned in the chart, the mip period of Mercury retrograde, often produce a reversal of short term trend. So July 9th could be a crest day.


As expected, after forming a low in Jupiter Sookshma, Nifty is moving up. We may expect a crest formation in Saturn Sookshma.

Putting everything together, we may expect, Nifty to move up from these levels, for a couple of days, and then go sideways for a day before and then start coming down..
Remember Kala Sarpa? The moves could be lightning quick, up or down?
Stop loss and waiting for Nifty to confirm its direction is a must.

Happy Trading!

Friday, July 5, 2013

Gold-An Astro Technical Picture July 05, 2013

Gold has come down quite a bit from its Nov 2012 highs of 32464. It is now trading in the region of 26400.
Technically, we suspect a diametric is forming is wave c of wave 4.Since International Gold is trading very close to mining costs possibly a temporary bottom formation could be happening.
Technically a diametric formation could be on the cards in the current wave 4..Astrologically we are looking at a short term upside ...

Jupiter and Neptune aspects influence long term trends here. Venus, Sun and their aspects with Pluto seem to have short term effects. Iam yet to understand long term effects of Pluto-Neptune or Jupiter Pluto.

From a trading point of view, Gold should improve in the short term. Waiting for completion of g leg and then buying for the medium term may be considered. Only after Gold makes its move first and that too with adequate stop losses.Jupiter Neptune trine on July 17 inspires confidence. The powerful effect could be spoilt a little bit with Saturn also joining the trine, but then we expect this last up move to complete a multi year bull market in Gold. The next cycle will be negative, but only after the short term uptrend..


Monday, July 1, 2013

Kala Sarpa Yoga and Nifty

Kala Sarpa Yoga
happens when all the traditional planets travel to one side of Rahu Ketu axis. The Yogam ends when one of the traditional planets crosses over to the other side.


On September 18, 09:19:02 am, Saturn will move post the coordinates of Rahu and end the Kala Sarpa Yoga.
How does it affect Nifty?
By increased volatility..

It generally is a depressive aspect. But then bears when depressed go for short covering and market rises. So we see both rise and fall during Kala Sarpa Yoga times.

Astro Technicals- Saturn 2012 to 14- A comparison with the past.

Saturn takes nearly 30 years to complete a full cycle of the zodiac. Last time it was in these parts of the sky, that is in Libra was in July 1982 to January 1985.During its tenure in Libra, Saturn goes retro twice. Let us see how Sensex behaved then, purely from a Saturn influence point of view:
We can see the entire period was one of steady uptrend interspersed with prolonged down trends inside the up channel.Since in 2013, we are in the period of Saturn about to become direct in its first retro effect for the current passage, we want a closer look at the similar situation then. To elaborate what had happened when Saturn became direct after its first retro passage?

On July 01, 1983, Saturn turned direct and a significant low was formed in 5 trading days.But even after rise the overall decline continued.Low or high can be considered as a reversal only and not literally.
Let us fast forward to 2013...

What do we see?
First the uptrend seems to be seen again, in clear channels. Amplitude seems to be more exaggerated maybe because Rahu is there with Saturn to increase the power of Saturn.
What could happen when Saturn turns direct on July 08, 2013?

Markets are rising towards the stationary direct situation. Given an orb of 5 trading days, we could possibly see a crest forming.. that is on or before July 17, 2013.Interesting thing is overall trend seems to be up..Now will Jupiter in Gemini cause a hiccup to the long term up trend? We will have to wait and see!