We begin as usual with the monthly charts...
Why?
1. If after E, we count the impulses as 1,2 and 3 ending at 8180, the third wave looks too well channelled. In an impulse way, the waves do not channel.I was hoping that the third wave would break the channel, by crossing 8250 but it did not.
2.If we assume that wave 3 has topped out then the next wave 4 should form a complex correction for about 7 months, that is upto April 2015.This is possible, but somehow does not look probable.
So we will park the Ascending triangle followed by impulse wave for the time being and go back to the diametric correction.
If so, then the daily chart should look as follows...
I have shown the expanded chart of the current F wave, which is a complex correction involving two diametrics, connected by an x wave.
The most important questions right now, are
2. Has the larger degree F wave ended?
3.Has the larger G wave down started? What would decide this?
Let us expand the last two daily waves and see further....
Option A.Wave g as a zigzag has consumed 19 trading days and moved the price from 7540 to 8180.
As per Neowave, if a previous trend has to reverse,then the last leg of the previous trend must be retraced in faster time.
Now the move from 8180 down has so far consumed 25 trading days and the price has not gone below 7540.
So according to this analysis, larger F wave is not yet complete. And possibly there could be another x wave followed by upward correction possibly as a flat or more likely as a triangle which could end larger F wave.
Option B: Now if g had concluded not as a zigzag, but as an Extracting Triangle,at 8160, then the development post 8160 has still time left, to retrace wave g in faster time.Another 14 trading days, to be precise. So within the next 14 trading days, if Nifty breaks 7540 and it reaches the channel bottom ( see the daily chart, the 0-x line extended), then we conclude that larger wave F has indeed completed and we are in for a deep correction of G wave for the next 13 months.
Looking at the overall economic environment, some of the results which have come in, political and governance performance of the incumbent Government and the counter steps being taken or proposed to be taken by the Western Governments, my bias lies with option A.
Also the Gann angle calculations which I had shared in this blog some time ago seems to indicate some more upmove.
The only difference in my recent counts is that I tend to consider the current wave environments as corrective.
All this is fine, but how does the present tradeable scenario look like?
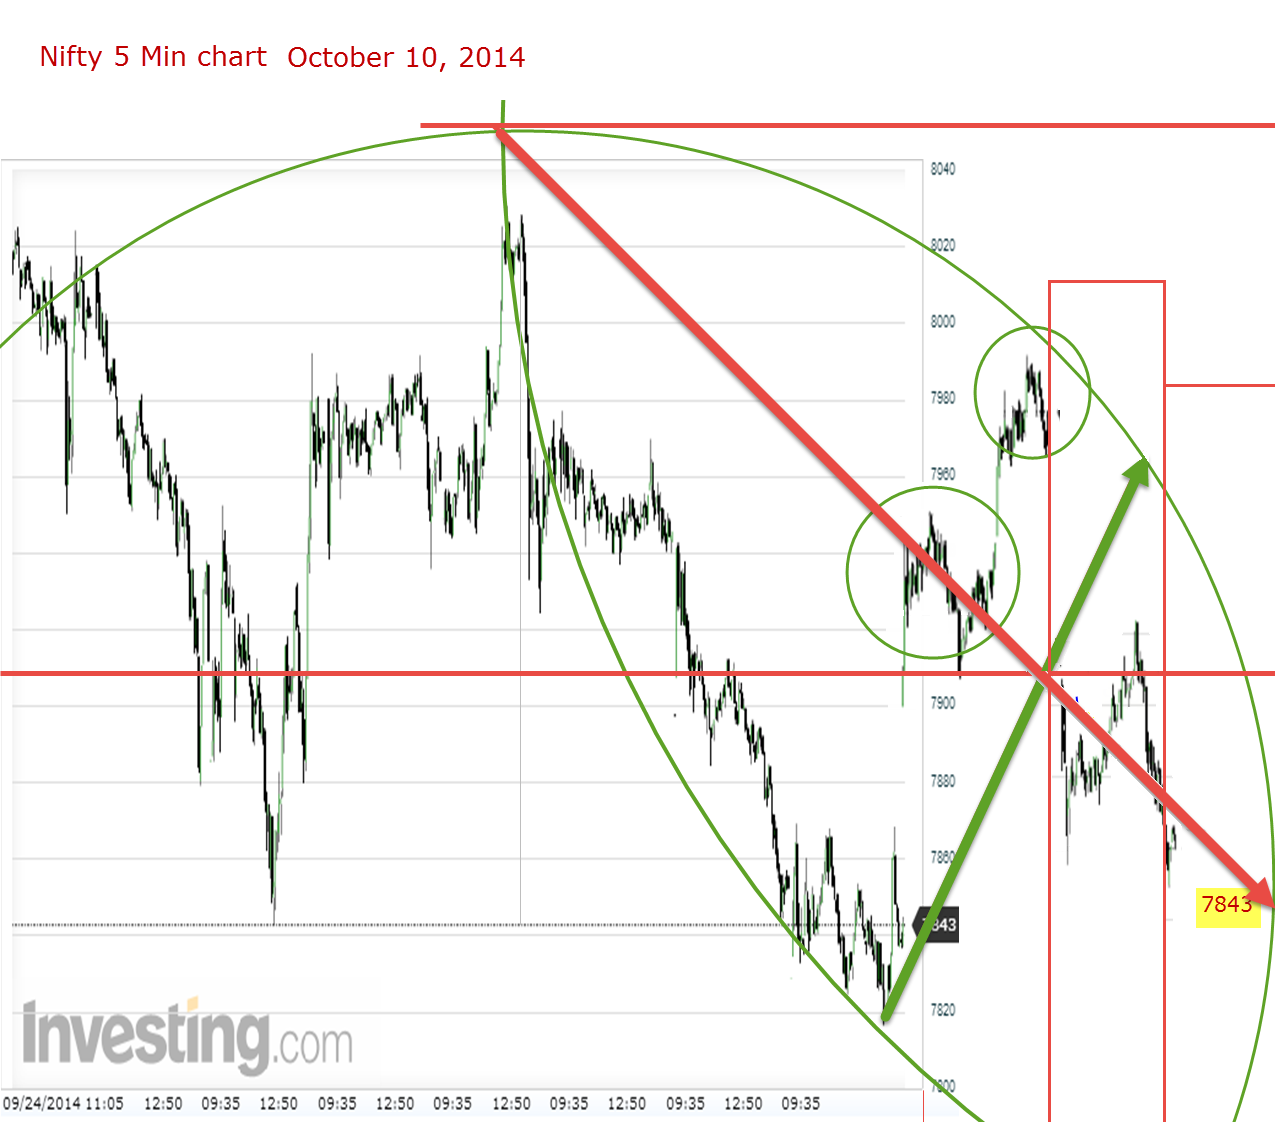
Let us look at the hourly charts...
We seem to be in a complex correction to the g wave. Recently we had broken down from a descending triangular formation and achieved 75% projection of the triangle, downwards. At present we seem to be in upward b with overhead resistance at 7848.After that I expect another down leg to complete the c wave. If b wave becomes very strong, then the c will fail later.
So the waves say be bullish on hourly, but be cautious because there may be a c round the corner.
Just compare with what the cycles and the momentum have to say!


