Pages

Wednesday, October 15, 2014

Nifty Cycles October 14, 2014

In technical analysis, we spend far too much time agonizing over price levels. Actually, time is also very important. In fact advanced Gann theories emphasize that price and time are interchangeable. One way we could measure time in market parlance is through the analysis of cycles.
Market movements are nothing but the composite effect of several cycles acting in unison. Some cycles are very long and some are very short. But all of them are always acting. When significant lows are formed, then several cycles bottom out immediately.So always, in cycle analysis, it is the bottoms which are important.
Here is a chart on  simple daily cycles which keep repeating...
What do we see? The dotted lines are getting bunched up by November, 03, 04 and 05.So we may expect an important low to be formed by that time.Saturn would just enter Scorpio,Debilitated Sun and  Venus could be conjunct in Libra and Ketu and Jupiter would be parting ways from a trine formation.Since the last quarter of a cycle is negative, we must be cautious from October 30 itself.

Is everything going to collapse?
Not really. Look at the monthly chart of Nifty....

Cycles are 18 to 21 months duration and are represented by black lines.The next cycle low is due by March 2015.
The relevant questions are, 
1. Will we see the fractal envelopes repeating? That is will Nifty form a shallow low and keep moving up later on? 
2. Or will she spike out and then form a sharp low?

Iam inclined to the later, that too by the second week of January 2015.Any how, there has to be one big upleg coming, as per this cycle analysis.
Enjoy the unexpected Holiday!


Tuesday, October 14, 2014

Nifty Technicals update October 14 2014


Our friend Pankaj had asked an interesting question.In the 30 min chart above, whether the point marked as 7832 c was not the completion of c, but the point marked as a ( 7797) was the completion of c? His reasoning is that the wave after 7797 has made a perfect impulse, as shown in the 5 min chart above.
My take is as follows.
1. I do not expect c to go down below 7797..c need not necessarily do so. For example if c is part of a triangle, then c would be smaller than b, right?
2. The environment is conducive for a triangle and not for an impulse.S&P is down, whereas inflation data and Reliance results favour bullishness. So majority participants are confused and that confusion is prevalent in Nifty movements.
3. Mostly impulse behaviour would be seen when world markets move in tandem..
4. Even by wave counts, if we shift c from 7832 to 7797 point, then degree wise c wave would not match.
Any way thanks a lot to Pankaj for this response. These things ae what makes writing this blog worthwhile.

Nifty Technicals for October 14, 2014

Nifty seems to be undergoing a complex correction in the recent legs of 30 min chart.What is of practical interest to us, is what will Nifty do next. It has formed "a"wave of three legs.
Currently it is in "b".Our interest is to know whether we have a flat formation here. So in this "b" leg, we must see an abc  and also to know how far Nifty will travel.Minimum distance b wave has to travel is upto 7905. But " b" also can travel beyond the beginning of "a" ( 7972).If one is long, then 7905 becomes crucial. If Nifty reverses from 7905, then we can go short at 7905. "c" should start downwards. In fact the size of b will tell us,  what will be the next move...  

Monday, October 13, 2014

Nifty Long term chart

Europe looks shaky. Gold and Silver have entered multi year bear market. Commodities are all down. Crude is entering a bear market.If S&P closes below 16334, then it is going to go into a reversal mode.
So what about Nifty? To understand I had looked into very long term charts of Nifty.
Here is the chart.
See how the bull trend respects the 45 degree parallels.A few more months of upmove is left before it tops out.January 2015 seems a likely month.


Nifty Technicals Oct 13 2014


Sunday, October 12, 2014

Nifty Astro Technicals October 13 to 17, 2014

It had been wild since September 26, 2014. But then we had been expecting such high volatility from an astro perspective. This week we may start seeing the beginning of the end.But it ain`t over yet.
Let me explain, what I meant...
 
I had been pointing out the destabilising effect of Rahu when the faster planets conjunct with him. It began with Mercury conjunct Rahu on September 16.Last week it was the turn of Sun.
If we see the chart on the left, you we see Rahu and Sun are still conjunct...Look how Mars and Moon add fuel to the fire!
Then   at 22 degrees, Venus is waiting her turn to confront Rahu. This will happen as the week progresses.Also I had pointed out last week that Sun Pluto and Venus Pluto squares are completed. So we are in the time band for a trough. Which means mid week we are in for a bottom..By the week end, Mercury retro meets his Master, Sun.That also should aid the reversal.Still a sustained reversal is some time away..Maybe we should be out of shorts by mid week and reach a wait and watch zone.
Here are the chart updates...
Maximum slippage I expect is 7835. If Nifty closes below this, then I think it is more bearish than we thought.
Or else, after some base formation, expect the next upmove to 7956 levels, after some resistance at 7920 or thereabouts. This is just a forecast..not a prediction. So be absolutely sure to commit money, only if you see the market moving as per the expectation..In such volatilie period. stop loss is a must..

Friday, October 10, 2014

Nifty Astro Technicals update:October 09, 2014

If there were a roller coaster, then this is the one!
Just look at what the Dow is going through....
In all my recent articles I had been emphasizing on the volatility in world markets, Nifty included..While such volatility is difficult to explain ( not impossible) technically, Astrology provides ready answers.Our humble pranams to those great Masters who had revealed so much to us!
Have a look at this Astro Technical Chart....
Mars Uranus trine
Sun Uranus Opposition with Lunar Eclipse
Sun conjunct Rahu
Venus square Pluto

I think we are about to see  one more bottom, before a take off.
Better fasten your seat belts. You could be blown away!
And never trust a trend when Mercury is retrograde. He is known as the Universal trickster.He is retrograde in Libra. It is all about balance!


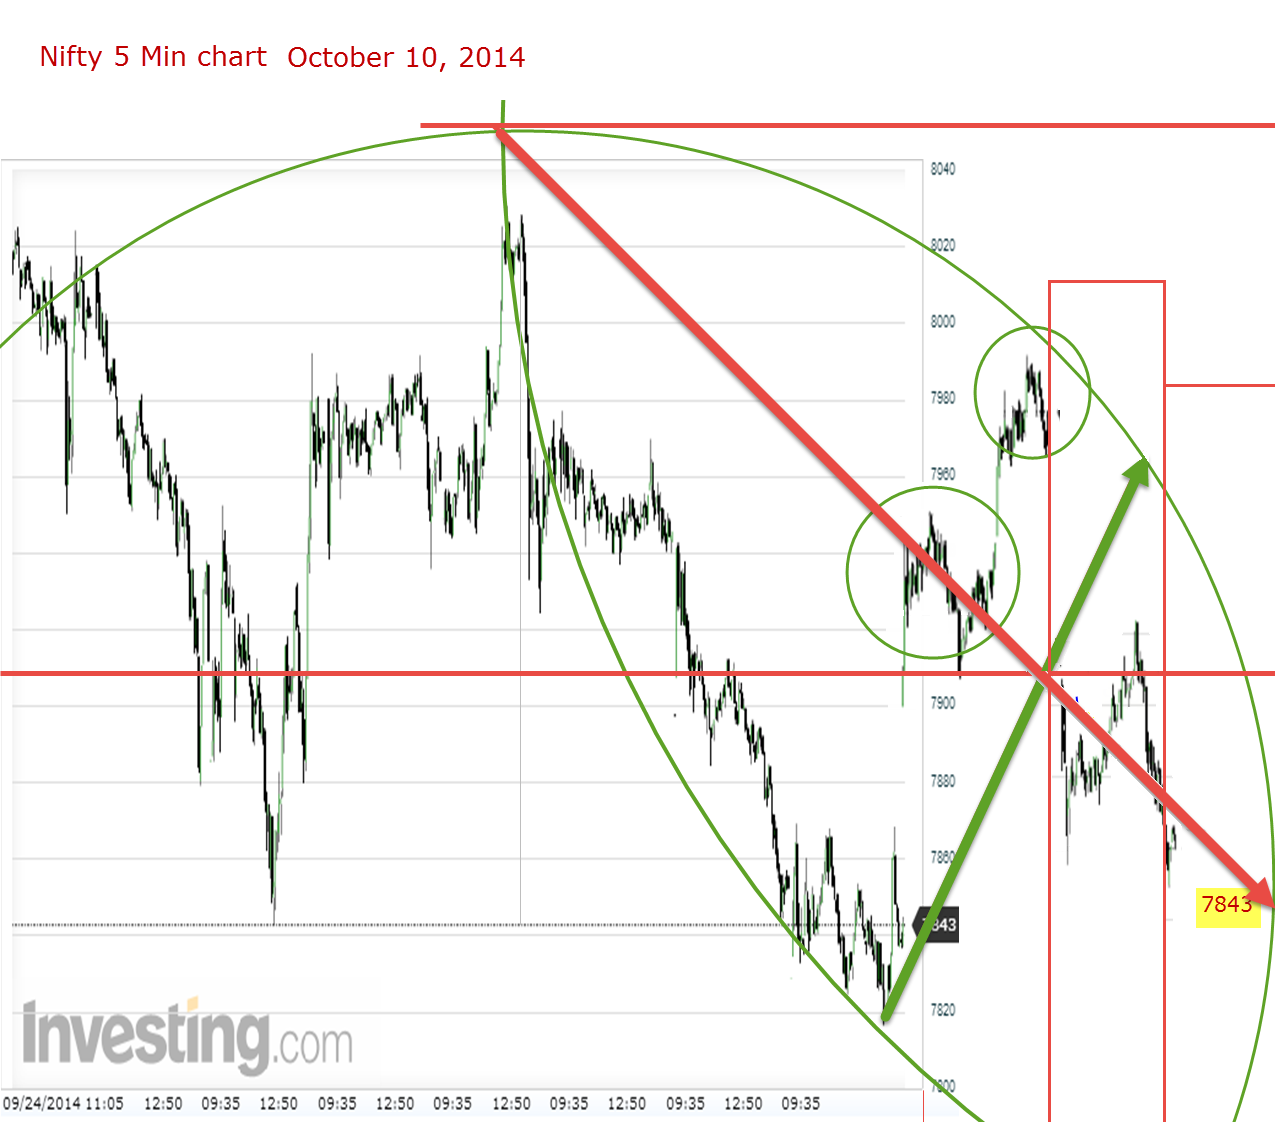
Here is an immediate chart....
 7910  and 7843 are immediate supports. Time limit  2 days.

Wednesday, October 8, 2014

Astro Technicals- Hindustan Unilever- October 07, 2014

Let us look at another stock, a famed multinational FMCG Company from a technical perspective..Iam referring to Hindustan Unilever Limited..
 What strikes us first, is that the long term price and time seem to be squaring. Which means Hindustan Uni Lever is in a major topping out process.Not too much of upside left for the moment...
What do the waves say?

 Yes, the waves also seem to confirm..we are in the 5th of a long term Elliott wave formation...Soon HUL has to start correcting.What could make HUL to correct? No idea...but something is definitely cooking.

This is how the parent is looking like....

Seems to be in 4th of fifth..Next up move may be used to exit positions from HUL.

Here is an astro analysis of HUL...
Trade harmoniously and safely!

Tuesday, October 7, 2014

Nifty Astro Technicals October 07, 2014

An update of our post of October 01...

An update of the momentum charts.....

Monday, October 6, 2014

Nifty Astro Technicals ICICI October 06 2014

We will look at another stock here, which moves in sympathy with Nifty most often...ICICI
In the monthly chart, we see ICICI completing wave 1 of a new impulse. Currently it is in wave 2..After the long term wave 2, ICICI is in for a fine upmove when bigger wave 3 starts.

Weekly chart shows the impulse divisions of wave 1 and the 38.2% retracement level for the current move. 1361 should be an important level.
Daily chart shows the down move labelling.Wave a should bottom out around 1361 levels and then an upmove of b should start. This can go up to the recent top...
30 Min chart shows further break up of the current wave c. Whatever immediate improvement we see should only be shorted. We may wait for wave c to be completed, before embarking on a positional buy.

Good luck!