If so then there is every chance that the monthly cycles also could extend beyond September.
If so then we are looking at a much bullish picture.
Looking at Monthly Gann Angles,
Nifty is approaching it`s long term 45 degree line..this is not a reversal point yet..Nifty could hug the line and travel farther...so there is no immediate clue here either..
Looking at Astrological indications,
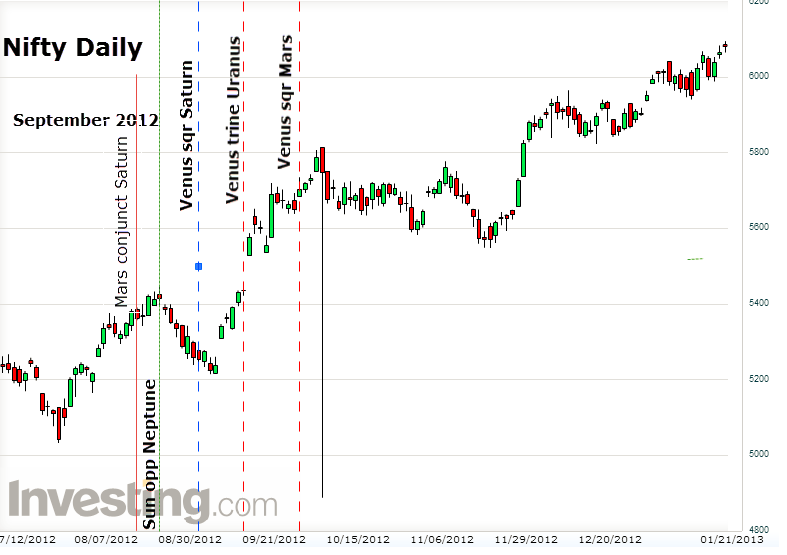
Slow moving outer planets and the Nodes ( Rahu and Ketu) must be involved in more than one kind of aspects for a significant top or bottom lasting several days or weeks, to form.As can be seen from the chart above, the skies are clear in September, as far as long term planets are concerned.The next significant formation is the Uranus Jupiter trine. While this begins on September 17, it actually becomes exact only on September 26.Market effects are generally seen 5 to 8 trading days thereafter.That would take us into the first week of October.
Now October seems to be a different ball game..
There are several significant aspects coming together..as shown in the chart.This may be analysed in a future post.
So we may cautiously conclude that September seems to be a month where the bull trend would continue.
Turning our attention to the short term...
Starting from the astro factors...
If we look at the immediate past, we see the following aspects:
August 23: Mars trine Chiron
August 26: Mars conjunct Saturn
August 26: Venus trine Uranus
August 26: Venus square Mars and Saturn
August 29: Sun opposition Neptune
September 03:Sun trine Pluto + Minimum Lunar Declination
September 05: Maximum Lunar Latitude
First two are the only ones which involve outer planets. Since the Nodes are not involved, there will be time delay in activation.Since the planets involved are mostly fast moving planets, inside Earth`s orbit, the effect could be shallow and or short lived. We saw a very short reaction in response to Venus Uranus trine. I expect a slightly larger reaction since (Mars and Saturn are involved), but not a trend reversal. (Support levels are given in the charts above.)That too for a very short period.It may manifest this week. If it does not, then we have to assume that the effect had already happened, in moving the trend from up to sideways.
Any which way, even if it happens, it must be taken as a buy on dips strategy and get on to the band- -wagon.
Aspect clusters are shown as A, B and C to delineate the different type of effects they have had on Nifty when they were operational.
Last week we saw how the current up move, is a break out of an Irregular triangle and how it could actually target 8200+. We also saw, how if this upmove crosses 8030, then the Impulse wave 3 of the alternative bullish option, could extend.
Here are couple of 30 min charts for better understanding. Iam persisting with the Diametric option open, till Nifty crosses September.
Wave f had consumed 338 half hour bars and wave g has so far consumed 200 bars. For equality we have another 138 more bars to go, which is 13 trading days.That is by September 17th.( That is the beginning of Jupiter trine Uranus..Is it a coincidence?).In this option, wave a of g had done an abc and had ended at 7968 on Aug 25th.Thereafter wave b of g had begun and we are currently in b of g. There could be a c of g to 7850 levels before wave c of g starts.As discussed last week, this could take Nifty to 8200+ levels.
In the second option,
In the second option, wave a had ended on August 19th at 7912 and wave b of g had ended on August 26th at 7863. Since then we are in wave c of g.This will become stronger from here on. In other words, if Nifty reacts this week, then option 1 is on. If Nifty strengthens this week, then option 2 is on. Here wave g is forming a zigzag and wave c could be a very powerful one, pushing Nifty upto 8463!
In any case, all the options look bullish for the near term.
Disclaimer: This blog is purely educational. Trading or investing based on these ideas is purely at the sole risk and responsibility of the reader.


