Please have a look at this blog post of January 06, 2013. We had discussed in detail the effect of Jupiter in Taurus and how the big positive planet will not allow a trend which he had commenced, to wither away, as long as he is in Taurus.
http://niftyastrotechnicals.blogspot.in/2013/01/astro-technicals-jupiter-and-taurusway.html
Well, Jupiter leaves Taurus on May 29th.So the current bullish fervour should last till Jupiter moves into Gemini.Mind you there could be corrections on the way, but mostly the bull trend will be maintained, is what I feel.Also whenever Uranus and Pluto are square and if Jupiter is also entering Gemini, then a blow off is seen. The severity of decline which happens afterwards depend on the long term planetary configurations afterwards.
We have already moved into life time high spaces...Several world Indices are already there. We do not see a wholesome all encompassing euphoria--definitely mass participation is absent because of the difficult Uranus Pluto combination.
So we conclude that we are in a powerful bull phase right now.
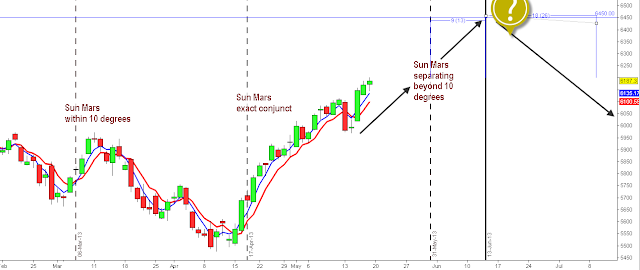
What caused the current big leg up and how long will it last? Have a look at the astro charts below.
We see that when several planets transited sensitive 17* of the chart, and when long term planets were involved in a mid point formation, we saw the beginnings of a huge rise.
We again see the confluence of several planets in the degrees of 26* and the New Moon Lunation of June 08 looks important, enough to cause a break in the current rise.Will there be a powerful reversal? We need to research further.
That will also be the period when Nifty will be going through Venus Antara Rahu sookshma- which again is traditionally associated with reversals. I had dealt with elaborately with these Dasa aspects in previous posts.
What about other studies? What do they indicate?
This is a long term cycles chart. This monthly chart also tells us that we are close to a top formation. We shall guess later as to what type of targets can be assigned.
Long term cycles tend to distort a lot, because of the existence of other cycles.
Let us see another long term chart...
This long term weekly chart also shows that we have major resistances in the 6338 areas.6338 is only 168 points away.
In the daily cycles chart, the resistances we see are 6250, 6300 and 6350.
We can see the 6250 resistance levels more clearly in this chart.
What does our Neo Wave analysis say?
Down move of May 13, took out 5 previous bull candles.The correction did not consume much time at all.So we assume that the a wave of B is still continuing.Currently we should then be c wave of a of B.
Wave B has retraced 119% of A.Strength of the move implies that it could go to 6354 even.This is also close to 6338, November 2010 top.
We may also consider the following alternative view, since B had further moved up surprisongly.
Here we consider the entire move from 4531, from December 2011 as a Diametric, bow tied.If so we are in the leg G, which should terminate around 6350.
Here is the 30 Minute chart for our understanding...
Present intra day stalling could be minute wave b.Next leg up may begin next week. Since prices have moved up so much volatility and two way movements cannot be ruled out.
Stop loss cannot be insisted more strongly.
We want each of the blog reader to be successful, safe and contented in trading.


