First we look at the technical picture followed by Astro charts.
Here is the broader picture with wave counts....
So as per Neo Wave Analysis Nifty should weaken by another 300+ points before the first target of 5548 is reached.Target date March 04, 2013.It is fascinating to see whether this projection will come to pass.
Markets rarely go up or down vertically and these interim movements can be profitably traded if we are vigilant.
Let us look at a Pitch fork chart...
It can be seen that the zone 5815 to 5845 is an important support zone.Since Nifty is oversold may be a bounce may happen at these levels..
Twiggs Money flow is exhibiting a small positive divergence which needs a confirmation from the price.Profit taking in the form of short covering could emerge which may account for the bounce.
Now February 26th seems to be an important date..Why? Because of some Astro reasons...
Let us see the Astros now....
February 26th is an Aquarian Full Moon.Moon moves between the First Quarter and the Full Moon between February 18 to 22, in the signs of Taurus, Gemini and Leo. The whole of Cancer gets nullified by Saturday and Sunday next.Full Moon occurs when Moon is in Leo.
On February 18, 2013, which is the First Quarter day, Saturn turns retrograde.This is an important signature during which we have seen reversals in the past. A detailed analysis was posted two weeks ago, which may be seen in the archives.
On February 19th, Moon reaches Minimum declination and also sees Moon at the maximum distance from the Earth.
So we expect a low to be formed on Feb 19 or 20 and then Nifty should move up some what.
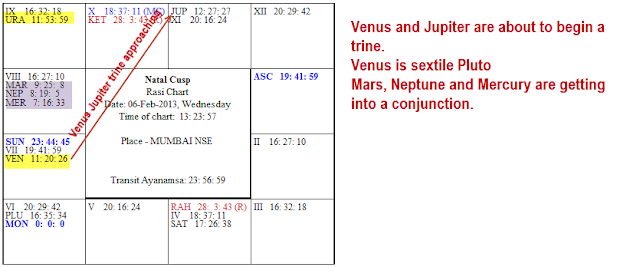
As can be seen in the chart below, every time we have a Sun Neptune conjunction, a reversal in on the dot or close by on either side of the conjunction date.Venus also enters Aquarius and trines the natal Jupiter and Saturn.
Our reading is that after a base formation or low formation for the first two or three days of the week, we may see a moderate up move towards February 26.
Since Sun and Moon square Jupiter on the New Moon day of February 26, down trend could resume post February 26th.
Here is an interesting aside. When was the last time that Saturn was in Libra and simultaneously Jupiter was in Taurus? It was 60 years before, in the 1950s! 1954 to be precise.
Since we did not have Nifty or Sensex then, I did a little snooping around for a Dow Jones chart.Here it is! So Iam a little more convinced that the long term up move may continue till May 2013, terminals not withstanding.
Markets have however entered a treacherous zone. It is highly hazardous to our Financial Health to venture out to swim in the markets without life jackets. These jackets are also called as Stop losses.
Happy trading!


