Thursday, September 13, 2012
Nifty Intra week review, September 12, 2012
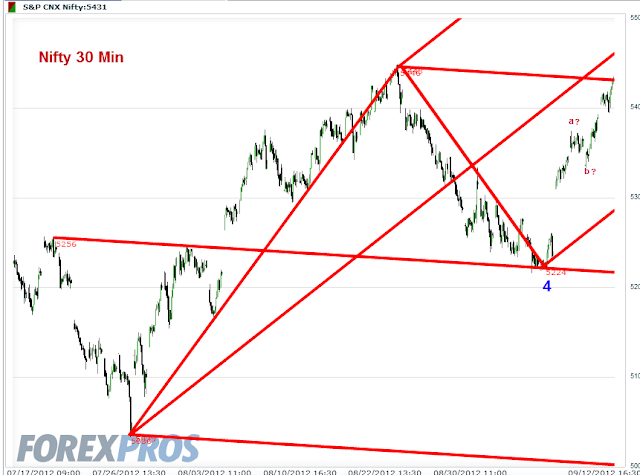
Here is the intraday 30 min chart.Either whatever rise we see are of the "a of Five" category or they are as marked in the chart and we are in c of 5.Market action within the next two days are crucial to determine directions.
Tuesday, September 11, 2012
Nifty September 10,2012-Interesting trendlines
Nifty is in the process of tracing a leg of impulse wave 5 of C of diametric D, which had started from December 20, 2011.
As per Neo Wave, leg b has great probability of touching 2-4 trend line in the coming days.There could even be a break of the trend line.Assuming the same angle of ascension, between lowest point of 2 and top of 3,we look at a probability of c ( and therefore the top of 5) at around 5525.Since the first leg of retracement should take the same time or similar time as taken by Nifty to move from 4 to 5, we have the retracement line as shown, returning to 5217...
If wave b deepens, then the classic 2-4 trend line may come into play...
All look as interesting possibilities.Looks like the Fed announcement of September 12 may cause initial euphoria followed by a reality check...
Sunday, September 9, 2012
Nifty Astro Technicals for week September 10 to 14, 2012
As expected Nifty began its fifth wave last week in the time band we had expected. That is from September 6th / 7th onwards. This week looks like mostly a continuation week .But the week beginning September 17th, some major fireworks are in the offing.
Let us first look at the Astro charts followed by Wave charts. As usual we look to astro charts for direction confirmation and to wave charts for the technical levels.
We examine the Ruling planets for a change.
Let us look at our wave picture for some price projections:
Have a great week of trading. As always these are just indicators. Price movement alone is the final deciding factor. If the price moves as per expectations then and only then take positions.
Let us first look at the Astro charts followed by Wave charts. As usual we look to astro charts for direction confirmation and to wave charts for the technical levels.
We examine the Ruling planets for a change.
Ruling planets for the week September 10 to 14 are Rahu, Venus,
Mars and Mercury. Their subs or their aspects or aspects to them could all have
market effects.
Since Ketu is in the house of Venus, we can consider Ketu as
well.
Moon will move through the stars of Rahu, Jupiter, Saturn, Mercury
and Ketu.
Sub lord of 4th house is Jupiter and of tenth is
Rahu. Since Rahu is in Saturn star, and since Saturn owns the fourth house as
well, Rahu is capable of giving fourth house effects also. Our assumption is
that the tenth house which represents the zenith point, points to improvement
in index values and fourth house points to decline in index values.
Looking at a slightly larger time frame,
Have a great week of trading. As always these are just indicators. Price movement alone is the final deciding factor. If the price moves as per expectations then and only then take positions.
Thursday, September 6, 2012
Intra week review- Nifty September 06, 2012
Pictures are worth a thousand words. See the graphs below:
Wave 05 should begin anytime now. Technically it is expected to be shorter than wave 03 time and price wise. And it looks like it is a terminal.
Wave 05 should begin anytime now. Technically it is expected to be shorter than wave 03 time and price wise. And it looks like it is a terminal.
Monday, September 3, 2012
Nifty Astro Technicals- Astro analysis for Sept 03 to 07, 2012
The previous week we had ended trading,on the verge of a Full Moon.In fact the Full Moon occurred at 19.28 hrs, ( for Mumbai coordinates,) on August 31, 2012.In our previous week`s post, we had mentioned that Moon reaches Maximum Latitude at 03.44 hours on August 31 and on the same day Moon crosses the Celestial Equator from South to North. So we have three lunar events happening in the same time band-August 30 to September 01, 2012.Such a phenomena generally leads to change in psychological mindset of the masses and that may reflect in the markets.Usually there is a reversal in price directions. Since we were trending down with the Nifty, we may expect a reversal shortly.
I have created a simple tabulation which records the various aspects of the week.Aspects are recorded date wise for the period September 03 to 07in the first left column.If an aspect continues for more than one day, then it is repeated for both the days. The second column, called Orb days, gives us the time band in which a particular aspect will be in vogue.( Effects of an aspect could extend beyond the time band, depending on the planets involved in the aspect.)
Aspects represent build up of special energies represented by the participant planets. The energy is re;eased into action only when a trigger planet gets connected. Most often it is the Moon.So the third column is about when Moon will connect with the aspect under consideration.Fourth column tells us the approximate period when these aspects could manifest.And the fifth column depicts the expected effect overall on the market. I have used Universal colour coding, where Red is negative and Green is positive. All other hues in between reflect market conditions in between.For example Mustard would represent a change in trend, from Negative to Positive.
Observations written beneath the tabulation are a record of the planetary effects on the Natal chart of Nifty, by the transiting planets.
Please click on the table and enlarge it for better viewing.
As always, these are all guidelines.Markets may agree or disagree with our observations.Over time we are seeing correlations, but always please wait for the price to confirm the direction of our expectations. Only then take a trade, that too with strict stop loss.
Have a great week of trading.
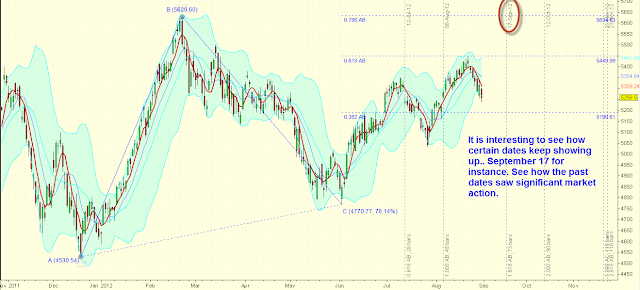
Nifty Astro technicals- a look at different ABC Retracements
It is interesting to see the same kind of dates and levels coming up with different kinds of ABC Retracements, in Nifty.
Let me illustrate:
The charts are simple and self explanatory. Critical dates seem to be September 04, 11 and 17.5400 comes across as an important resistance.
Does this correlate astrologically?
We will see in the next post
Let me illustrate:
The charts are simple and self explanatory. Critical dates seem to be September 04, 11 and 17.5400 comes across as an important resistance.
Does this correlate astrologically?
We will see in the next post
Nifty Astro Technicals September 03 to 07, 2012
September03 and 04 should decide for us.
Here is a look at retracements:
Wednesday, August 29, 2012
Nifty Wave update
We are in right earnest into wave 4 of corrective wave C of the bigger diametric D.Wave C had commenced from June 04,at 4770. Levels of 5241 to 5273 should act as a big support for the current decline. "a of 4 "should probably be there somewhere.We still have a recovery leg, a minor b up and a c of 4 down.Price action has entered the Wave 2 region as can be seen from the chart.So far the Terminal Impulse has been acting up right on cue.
Nifty Weekly Cycles
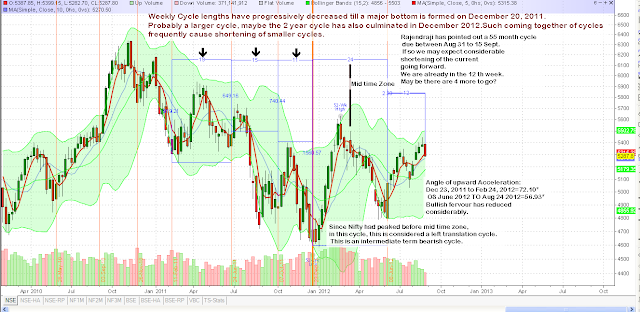
Nifty Weekly cycles are interestingly poised. There has been a reduction in the upward thrust we saw in December 20, 2011 and the one we saw from June 04, 2012.Also as Rajendraji points out, we are due for another long term cycle, the 55 month cycle. The time band is August 31 to September 15, according to him.If so the present weekly cycle will be shortened such as what we saw prior to December 20, 2011.
Our Wave theory is suggesting one more upside post the current 4th wave.If these two synchronize,then a major cycle top is due within the next two weeks. Astrologically, we are in the time band between two square formation of Uranus and Pluto.
Our Wave theory is suggesting one more upside post the current 4th wave.If these two synchronize,then a major cycle top is due within the next two weeks. Astrologically, we are in the time band between two square formation of Uranus and Pluto.
Subscribe to:
Comments (Atom)


