Sunday, May 15, 2016
Monday, May 2, 2016
Nifty Astro Technicals May 02 to 06, 2016
Jupiter opposite Neptune, Mercury Retrograde, Jupiter becoming direct and the central time band of Jupiter square Saturn all point to a low in the next few weeks from which there could be a strong rebound upwards.
For more detailed analysis, join our paid blog services.
Send a mail to tekkiesuresh@gmail.com for more information.
Sunday, April 17, 2016
Nifty Astro Technicals April 17, 2016
As expected Nifty rose once again..this time crossing the 200 day exponential moving average as well.We are in the last leg of wave b, that is we are in wavelet g which may give way any moment now. Then we ought to see wave C down and only after wave C is complete will the bear be truly dead and gone.
Having said this, I had been warning for quite some time now that the next bullish run is about to begin.. I had been saying this even when the markets were falling hugely. That the medium and long term look quite bullish from now on.
The 30 minute chart brings out the diametric nature of the development. Our markets are truly prone to diametric formations and it is vital to understand them fully if we wish to make money consistently.
Two most important formations looming on the horizon are Mars becoming Retrograde on April 17th and immediately within a day, Pluto also becomes retrograde.
It isc also important to understand that Planets such as Uranus, Neptune and Pluto affect masses and so are VERY important from a stock market perspective. Also note that Neptune is a dreamy planet and hard aspects to it can bring about a market fall most consistently.
To understand more, please subscribe to our paid blog services. Just send a mail to tekkiesuresh@gmail.com for more information regarding our services.
Sunday, January 31, 2016
Nifty for the week of Feb 01 to 05, 2016
This is a chart of 52 week high lows every day, of all stocks traded in NSE in the month of January 2016..Chart on top is Nifty Futures Chart for the same period.
This shows the internal strength of the market as a whole.
We see that when number of stocks hitting 52 week highs keep coming down, Nifty also goes down.
Also the green line represents the number of stocks hitting low and as the market comes down, this number shoots up.On January 18, the number of stocks hitting 52 week low was 228 and within two days the market formed a bottom.
When 52 week high numbers are rising, money flows into the market and when 52 week lows are rising money flows out of the market.
For the market to begin a consistent bull run, 52 week high numbers must stay consistently above 50 at least.
Right now we are at a truce situation. The internals are yet to show improvement. So we need to be cautious of the market rise.
To know more on Nifty analysis using astro and other techniques, please join our paid subscription. Send a mail to tekkiesuresh@gmail.com for more details.
Saturday, January 23, 2016
Saturday, January 16, 2016
It is all cyclical
The Bear is not done yet....
As we can see the Fear levels which we had seen in August 2015 have not yet manifested..The Bear has to bring out such fear and cause capitulation to complete the bear market.
As it is always said, Bull markets climb a wall of worry and Bear markets descend a slope of hope.
Every upward retracement must kindle hope, every subsequent down turn must crush it and one big fall should make most investors and traders to give up and sell everything. This phenomenon is called capitulation.
This has not happened yet. When it does this bear phase will be over.
VIX indicates that there is still a fair bit of complacency left.

But the end is quite close. Astro has been indicating it.
Let us see what the cycles have to say.
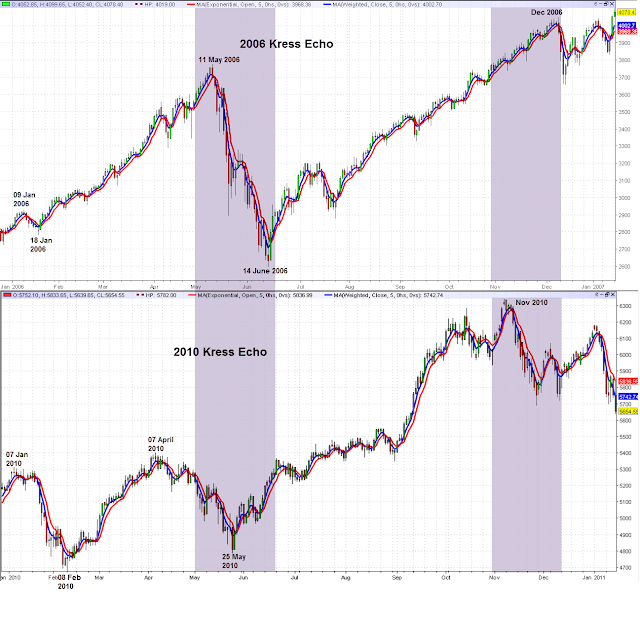
According to Kress Cycles, this year`s market movements will have an echo from the markets, 6,10 30,60 and 120 years ago. Let us ignore all those very old cycles and look at the recent ones, 6 and 10 year cycles.
We see, according to the echo of the past, market should bottom out in a week or two and then begin a rise into April/ May 2016. Note that they may not be exact replicas but some similarities could be there.
That the current bear market does not end now, but only in April 2016 is a possibility.
Does Astro correlate this?
Yes!
To know more subscribe to our services. Send a mail to tekkiesuresh@gmail.com
Monday, January 11, 2016
Astro Analysis January 10, 2015
On January 09, Rahu moves to Leo and Ketu to Aquarius..
How were the past experiences of such moves?
When Rahu enters Venus star,we see an important Square between Saturn and Jupiter.Several planets in the degree orb of 20 to23 degrees,
Here we see Saturn closely aspecting Rahu.
So first half of the year is expected to be better than 2015 and second half, worse than 2015.
For detailed analysis and for trading levels, please subscribe to our paid subscription service. You may send a mail to tekkiesuresh@c gmail.com for more details and clarifications.
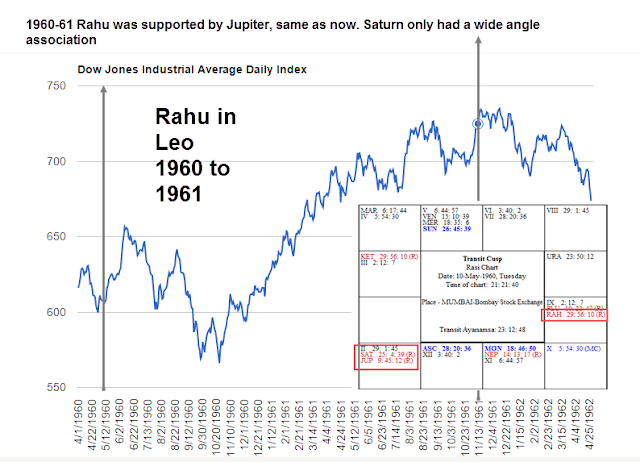
How were the past experiences of such moves?
Consistent down move.
Flat moves with huge volatility
We see Rahu being supported by trine aspects from Jupiter and Saturn.From a double bottom market moves up.
Immediately on entering Leo, Rahu conjuncts Jupiter.This will lend support to Rahu. Also Rahu trines Sun, its Star lord soon after it enters Leo.
Three important time zones when Rahu is in Leo:
When Rahu enters Venus star,we see an important Square between Saturn and Jupiter.Several planets in the degree orb of 20 to23 degrees,
Here we see Rahu conjunct Jupiter and trine Pluto..Several long term planets are getting into formation. 2016 will be hugely volatile.
Here we see Saturn closely aspecting Rahu.
So first half of the year is expected to be better than 2015 and second half, worse than 2015.
For detailed analysis and for trading levels, please subscribe to our paid subscription service. You may send a mail to tekkiesuresh@c gmail.com for more details and clarifications.
Sunday, December 27, 2015
Astro Analysis Dec 27 2015
Let us start from where we left last time. In Nov post, we had concluded,
"Expect a run up to the date when Jupiter exits Leo.Major correction after that. Right now Uranus retro and Pluto are approaching each other which is bullish".
The chart shown above has been updated up to December 24, 2015.
Date when Jupiter exits Leo is August 11, 2016. So expecting a run up to this date is actually a medium term projection and this is valid right now.
Uranus and Pluto square is close from December 18 2015 to March 19 2016.Their mid date is February 02, 2016. So the short term expectation is that we may see a rise up to February 02.
Other aspects and factors which correlate market moves are reserved only for paid subscribers.
Just send a mail to tekkiesuresh@gmail.com and we will assist you to become a paid subscriber.
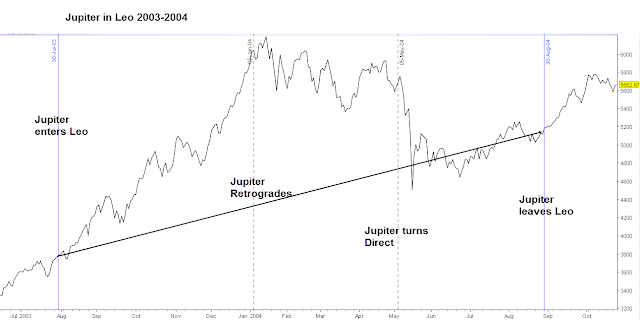
Let us examine Jupiter in Leo stations, especially the retro and direct stations more fully and arrive at an expectation for 2016...
This is the 1979 1980 chart of Sensex. We find the market bottoming out closer to the Jupiter retrograde date and higher top during the time when Jupiter is retrograde.Market ends up higher during the time Jupiter was in Leo.
In 1991-92, we see that the huge run up to Harshad Mehta peak began 6 days before Jupiter retrograde of January 01, 1992.Once again the peak was formed during the time Jupiter was retrograde. Also we see the market ends up higher during the time Jupiter was in Leo.
2003-04 is a fascinating astro contrast. Market reverses direction once again during the retrograde.Soon after turning direct, it reverses once again and continues its upward march.
In 2015, markets fell when Jupiter entered Leo. They have been continuously falling. Jupiter becomes retrograde on January 08th.So by past form, can we expect a reversal during this period? If so we are looking at markets to further improve.If so Nifty and Sensex could rise up in the channel shown above and surpass the all time high of 9119.
So astrologically bullish times are round the corner.
Happy New Year! .
Monday, November 30, 2015
Astro Analysis Nov 30, 2015
Expect a run up to the date when Jupiter exits Leo.Major correction after that. Right now Uranus retro and Pluto are approaching each other which is bullish.
For more analysis and how to trade from these developments, join our paid subscription. Send a mail to tekkiesuresh@gmail.com for more details.
Thursday, November 5, 2015
Astro Analysis Nov 05 2015
Rahu getting involved with Venus and Mars, points to a trough around November mid month, Should see a recovery thereafter.
For detailed analysis, join our paid subscription list.
Subscribe to:
Comments (Atom)


