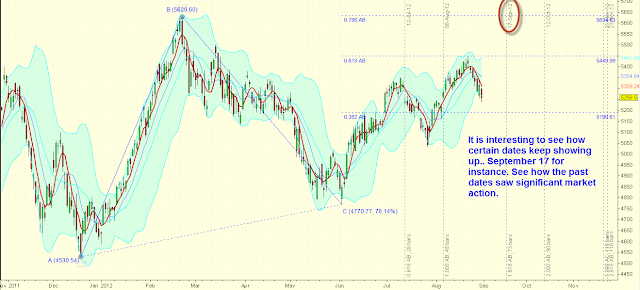
It is interesting to see the same kind of dates and levels coming up with different kinds of ABC Retracements, in Nifty.
Let me illustrate:
The charts are simple and self explanatory. Critical dates seem to be September 04, 11 and 17.5400 comes across as an important resistance.
Does this correlate astrologically?
We will see in the next post
Monday, September 3, 2012
Nifty Astro Technicals September 03 to 07, 2012
September03 and 04 should decide for us.
Here is a look at retracements:
Wednesday, August 29, 2012
Nifty Wave update
We are in right earnest into wave 4 of corrective wave C of the bigger diametric D.Wave C had commenced from June 04,at 4770. Levels of 5241 to 5273 should act as a big support for the current decline. "a of 4 "should probably be there somewhere.We still have a recovery leg, a minor b up and a c of 4 down.Price action has entered the Wave 2 region as can be seen from the chart.So far the Terminal Impulse has been acting up right on cue.
Nifty Weekly Cycles
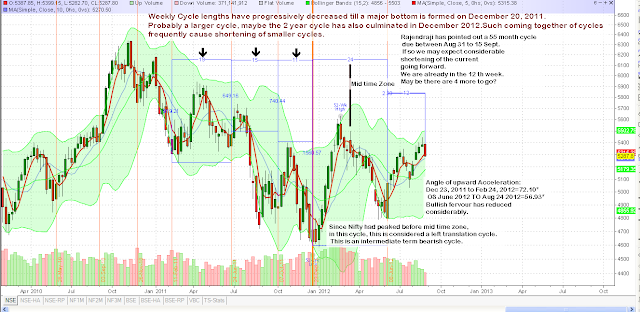
Nifty Weekly cycles are interestingly poised. There has been a reduction in the upward thrust we saw in December 20, 2011 and the one we saw from June 04, 2012.Also as Rajendraji points out, we are due for another long term cycle, the 55 month cycle. The time band is August 31 to September 15, according to him.If so the present weekly cycle will be shortened such as what we saw prior to December 20, 2011.
Our Wave theory is suggesting one more upside post the current 4th wave.If these two synchronize,then a major cycle top is due within the next two weeks. Astrologically, we are in the time band between two square formation of Uranus and Pluto.
Our Wave theory is suggesting one more upside post the current 4th wave.If these two synchronize,then a major cycle top is due within the next two weeks. Astrologically, we are in the time band between two square formation of Uranus and Pluto.
Monday, August 27, 2012
Nifty Lunar effects August 27 to 31, 2012
Within the larger context of market movements explained in other posts today,based on stellar positions of the Moon and its sub lord movements, we may hazard the following probabilities:This week, markets may drift lower till a reversal commences on August 31.
August 27: Moon is in Venus: Market may begin normally, even improve and then dip lower intraday. Recovery by close.
August 28: Moon is in Sun. Recovery of late evening may continue today
August 29;: Moon is in Moon star. Negative day.
August 30. Moon is in Mars star. Negativity should continue
August 31: Negativity may continue Reversal upwards expected.
Intraday probability techniques are very much under development. So please see the price movement and enter trades with the highest risk reward ratio in your favour.
Sunday, August 26, 2012
Nifty Wave Scenario Aug 27 to 31, 2012
With the neutral triangle in wave 2 and with wave 3 beginning right on cue, we seem to be progressing satisfactorily towards wave 4 and 5 of this wave C of the diametric leg D.
This then is our preferred counts for the week, unless the market communicates otherwise....
An analysis using Fibonacci time zones, retracements and Gann lines...
Here is the retracement on the hourly...
Whether it is wave counts or astro projections, unless the price moves in the anticipated direction and confirms all positions are dangerous. However sure we are do not ever trade without a stop loss.
Have a wonderful week of trading. Do post your comments-that sure as heavens, enthuses me and keeps me going!
Planetary aspect clusters and effect on Nifty
When there are more than one pair of planetary aspects coming closer together in a time band, we may expect to see market reactions happening. Always the clusters would signify a change in direction in the market.Inside the time band, the event will manifest only if lunar phenomena takes place. It could be anything, a New Moon, Full Moon, a powerful declination change, or a conjunction of Moon with the major set of planets which form part of the aspect cluster.
We can see in the chart above, how every major top and bottom are defined by planetary aspect clusters and how the effect manifests when Moon gets involved.A powerful single aspect such as Sun square Jupiter of Jan 24 had only a cursory effect.
Examining the phenomena, closer to our present time of trading we continue to see correlations:
Accordingly the Full Moon of August 31 assumes reversal significance. Up or down will always depend on how the market was, going into the lunation.Interestingly, on September 04, Moon opposes Saturn & Mars, squares Venus,trines Sun, Mercury and Pluto all in 24 hours!
In plain words we expect the present small decline to persist this week. We expect a reversal on August 31. We expect a sideways market with ups and downs till September 4. Then we expect an upward reversal post September 04.Does the projection remind you of a 4th wave or a 2nd wave or a B wave? If so then probably you are correct, because Neo Wave suggests that we are in the 4th wave of Wave 3 of Wave C.More of it in the next post.
All this is probability projections and we will make our trading moves only when Nifty confirms her intentions with price moves.
Saturday, August 25, 2012
Nifty pivots for the week beginning August 27 2012
As expected Nifty had reversed on August 23, 2012. With Moon reaching its southern most declination on August 26th, this reversal should end by August 28th and a recovery of sorts ought to begin. 5350 is the downward level to watch. If it holds then upward move may continue.
Wednesday, August 22, 2012
Monday, August 20, 2012
Subscribe to:
Comments (Atom)


